Ratchaburi Weather and Climate: A Comprehensive Guide
Ratchaburi has relatively stable weather with very warm temperatures.
It is also known for its large amounts of rainfall.
Let's now guide you through the climate details for a complete overview.
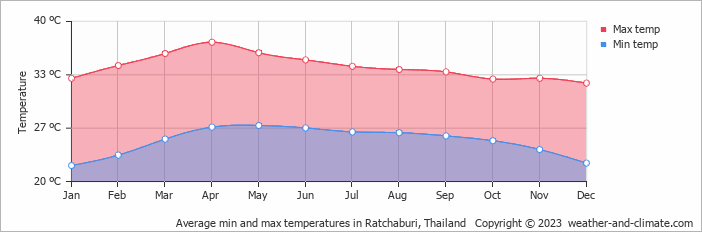
Average maximum day and minimum night temperature
With minimal seasonal shifts, Ratchaburi experiences a constant climate year-round. Typically, average maximum daytime temperatures range from a very hot 37°C in April to a very warm 32°C in the coolest month, January.
Nights are cooler, with lows often dropping to around 22°C during the colder months. Check out our detailed temperature page for more information.Temperature ranges by month
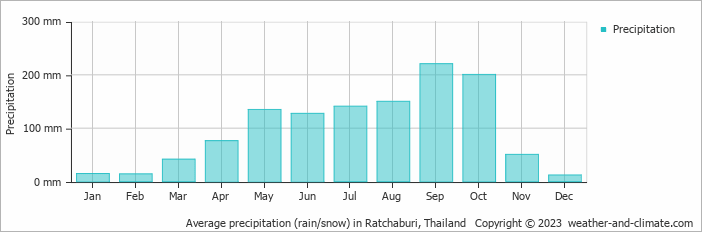
Precipitation and rainy days
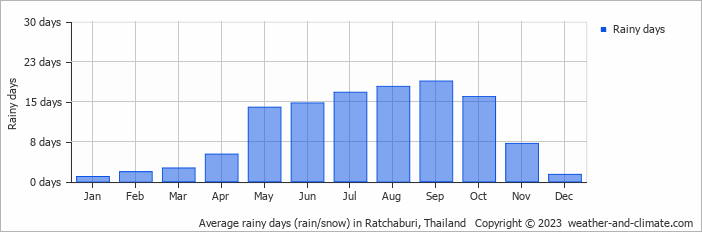
Ratchaburi has a notably wet climate with abundant precipitation, recording 1183 mm of rainfall per year. The climate in Ratchaburi shows significant variation throughout the year. Expect heavy rainfall in September, with an average of 221 mm of precipitation over 19 rainy days. In contrast, December offers drier and sunnier days, with around 12 mm of rainfall over a single rainy day. For more details, please visit our Ratchaburi Precipitation page.The mean monthly precipitation over the year, including rain, hail and snow
The average number of days each month with precipitation
Sunshine over the year
For those who appreciate different seasons, Ratchaburi serves as an ideal destination. Expect longer, more sun-filled days in December with an average of 8.8 hours of sunshine daily, and embrace the darker days in September, offering only 3.6 hours of daily sunlight. Visit our detailed sunshine hours page for more information.Monthly hours of sunshine
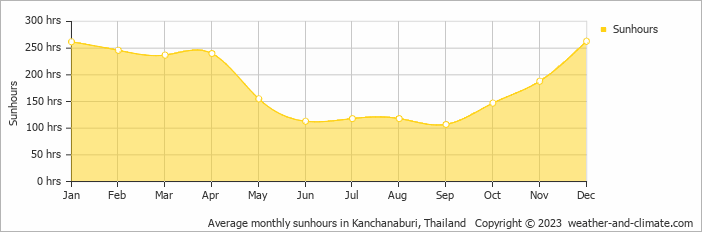
Daily hours of sunshine
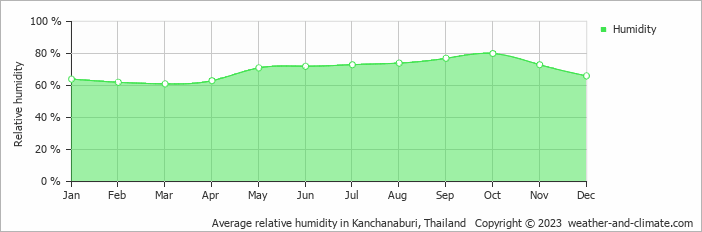
Average humidity
The relative humidity is high throughout the year in Ratchaburi.
The city experiences its highest humidity in October, reaching 80%. In March, the humidity drops to its lowest level at 61%. What does this mean? Read our detailed page on humidity levels for further details.
Relative humidity over the year
almost clear and no rain clear and no rain partly cloudy and no rainForecast for Ratchaburi
 5 m/s
5 m/s![]() 4 m/s
4 m/s![]() 4 m/s
4 m/s![]()
Select a Month of Interest
Check the conditions for any month of the year.
The best time of year to visit Ratchaburi in Thailand
Other facts from our historical weather data:Most rainfall (rainy season) is seen in August, September and October.
Yes, the months of January, February and December are very dry.
April has an average maximum temperature of 37°C and is the hottest month of the year.
The coolest month is January with an average maximum temperature of 32°C.
September tops the wettest month list with 221 mm of rainfall.
December is the driest month with 12 mm of precipitation.
December is the sunniest month with an average of 263 hours of sunshine.
No idea where to travel to this year? We have a tool that recommends destinations based on your ideal conditions. Find out where to go with our weather planner.


