Puerto Clocker Weather & Climate: Best Time to Visit
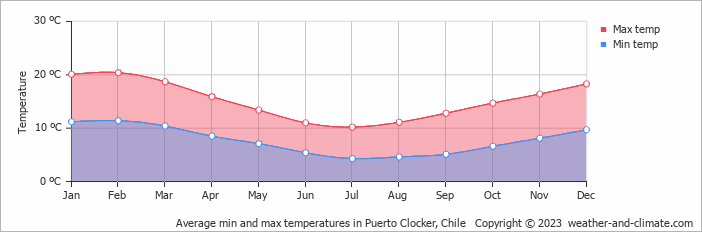
Temperatures in Puerto Clocker, Los Lagos, Chile, shift moderately through the seasons. The warmest month is February at 20°C (68°F), and the coolest is July at 10°C (50°F).
Rainfall is high, totalling around 2917 mm (115 in) per year. June is the wettest month and January the driest. Sunshine peaks in January, when the city sees around 7.0 hours of sunshine per day.
Monthly Temperature in Puerto Clocker
In Puerto Clocker, seasonal changes bring about a moderate variation in temperatures. Average maximum daytime temperatures range from a pleasant 20°C (68°F) in February, the warmest time of the year, to a chilly 10°C (50°F) during cooler months like July.
At night, you can expect temperatures ranging from 11°C (52°F) in February to around 4°C (39°F) during July.
Check out our detailed temperature page for more information.
Temperature ranges by month
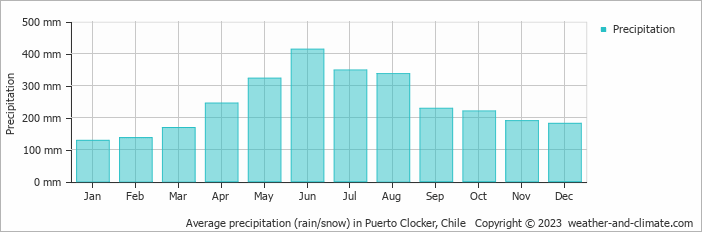
Rainfall in Puerto Clocker
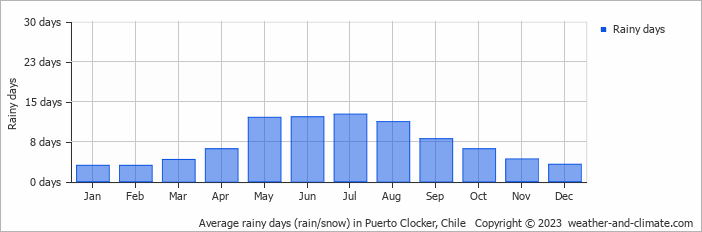
Puerto Clocker has a notably wet climate with abundant precipitation, recording 2917 mm (115 in) of rainfall per year. Significant seasonal changes in precipitation occur throughout the year. In the wettest month, June it receives heavy rainfall, averaging 413 mm (16 in) of precipitation, recorded across 12 rainy days. In contrast, the driest month January brings less rainfall, with 128 mm (5 in) over 3 rainy days. For more details, please visit our Puerto Clocker Precipitation page.
The mean monthly precipitation over the year, including rain, hail, and snow
The average number of days each month with precipitation
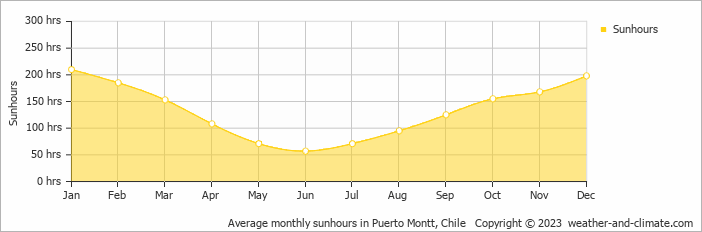
Sunshine Hours in Puerto Clocker
Seasonal changes in sunshine hours are quite dramatic in Puerto Clocker. While January receives considerable daily sunshine with up to 7.0 hours, June marks the darkest time of the year, where sunshine is scarce with only 1.9 hours of sunlight per day.
Visit our detailed sunshine hours page for more information.
Monthly hours of sunshine
Daily hours of sunshine
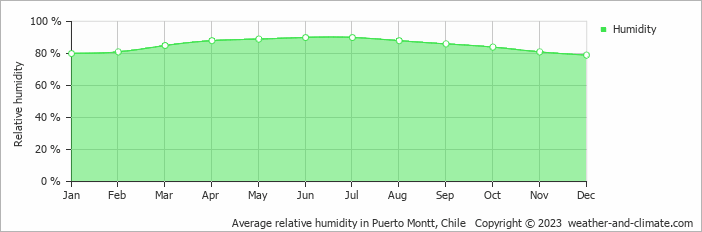
Humidity in Puerto Clocker by Month
The city experiences its highest humidity in June, reaching 90%. In December, the humidity drops to its lowest level at 79%. What does this mean? Read our detailed page on humidity levels for further details.
Relative humidity over the year
Puerto Clocker 3-Day Forecast
Check the conditions for any month of the year.


