Pica Weather & Climate: Best Time to Visit
Average temperatures, rainfall, sunshine and the best time to visit Pica.
Climate overview of Pica
Pica, in Chile's Tarapacá region, maintains a steady warm climate throughout the year with little temperature variation. The area experiences desert-like conditions with almost no rainfall year-round. People come to Pica to taste the famous Pica lemons and explore the green oasis surrounded by the Atacama Desert. Let's explore the climate details to provide you with a complete overview on when to visit.
Pica Weather by Month
Pick a month to see the average temperature, rainfall and sunshine in Pica — and find the best time to visit.
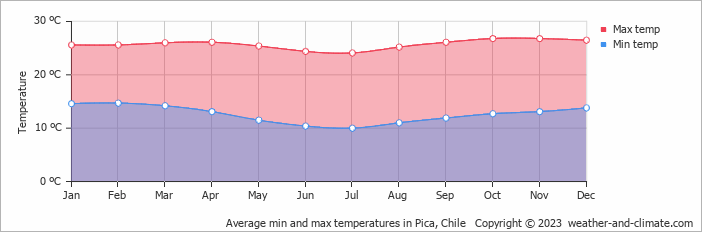
Monthly Temperature in Pica
With minimal seasonal shifts, Pica experiences a constant climate year-round. Typically, average maximum daytime temperatures range from a comfortable 27°C (81°F) in October to a comfortable 24°C (75°F) in the coolest month, July.
Nights vary from 15°C (59°F) in October to around 10°C (50°F) during the colder months.
Check out our detailed temperature page for more information.
Temperature ranges by month
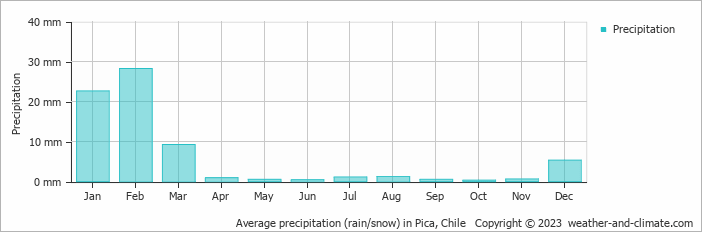
Rainfall in Pica
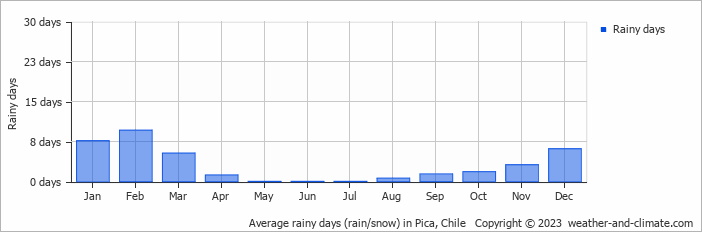
Pica is known for its low rainfall, with yearly precipitation amounts around 71 mm (2.8 in). The climate in Pica shows significant variation throughout the year. Expect low rainfall in February, the wettest month, with an average of 28 mm (1.1 in) of precipitation over 10 rainy days.
In contrast, the driest month October offers drier and sunnier days, with around 0.3 mm (0.01 in) of rainfall over 2 rainy days. For more details, please visit our Pica Precipitation page.
The mean monthly precipitation over the year, including rain, hail, and snow
The average number of days each month with precipitation
Best Time to Visit Pica
Whether you visit in any month, you'll experience the same reliably pleasant weather. This makes it perfect for flexible travel planning. Planning your next adventure but unsure where to go? Our climate tool suggests perfect locations tailored to your preferred weather conditions. Discover your ideal travel destination with our weather planner.
Frequently asked questions about the climate in Pica
What is the best time to visit Pica?
Pica has a distinct dry season from January to December.
What temperatures can I expect in Pica?
Daytime highs range from 24°C (75°F) in July to 27°C (81°F) in October. Nighttime lows range from 10°C (50°F) to 15°C (59°F). Temperatures stay relatively stable year-round.
How much rain does Pica get?
Annual rainfall is around 71 mm (2.8 in). February is the wettest month with 28 mm (1.1 in), while October is the driest with 0.3 mm (0.01 in).
Pica 3-Day Forecast
Pica 3-Day Forecast
Pica on the map
Pica is highlighted — select any city to see its climate.
Popular this month
Where to go in June — average daytime high across popular destinations.
Bucket list
Need travel inspiration? Check out our bucket list articles and be inspired.
 The 10 most alternative cities in South America
Discover South America's top 10 alternative cities! From Valparaíso's vibrant streets to La Paz's high-altitude charm and Medellín's innovative spirit.
 Torres del Paine
Torres del Paine is an huge national park on the border with Argentina. It is possible to walk here along craters, high-rising mountain ridges, over glaciers and through vast majestic tundra.
Explore Patagonia
A tour through Patagonia brings you to the end of the world. That’s why Patagonia is a bucket list destination for many. We recommend to visit Patagonia from November to early March.
Enjoy the silence and peace in a spectacular landscape
This lodge guarantees privacy and exclusivity for those seeking to get away from mass tourism and enjoy the silence and peace in a spectacular landscape.