Ñilque, Chile - Weather and Climate
The weather in Ñilque, Los Lagos, Chile can vary greatly throughout the year.
Temperatures shift from pleasant
to cold over the course of the year.
It also experiences much rain/snowfall throughout the year.
Now, let’s break down all the climate details for a clearer picture.
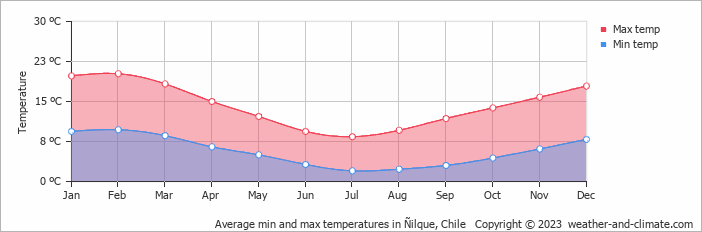
Average maximum day and minimum night temperature
Depending on the time of the year, temperatures range from pleasant to chilly in Ñilque. Average daytime temperatures reach a pleasant 20°C in February. In July, the coolest month of the year, temperatures drop to a chilly 8°C.
At night, you can expect cooler temperatures, with averages dropping to around 2°C during this month.Check out our detailed temperature page for more information.
Temperature ranges by month
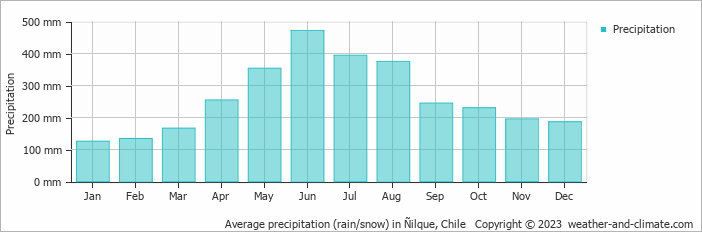
Precipitation and rainy days
Ñilque has a relatively rain/snowy climate with high precipitation levels, averaging 3129 mm of rain/snowfall annually. Ñilque can be quite wet during June, receiving approximately 471 mm of precipitation over 13 rainy days.
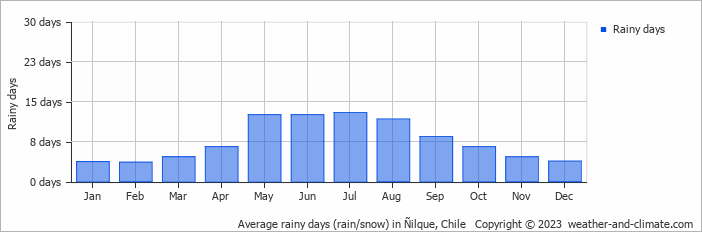
In contrast January, experiences much drier conditions, with 125 mm of rainfall, spread across 4 rainy days. For more details, please visit our Ñilque Precipitation page.The mean monthly precipitation over the year, including rain, hail and snow
The average number of days each month with precipitation
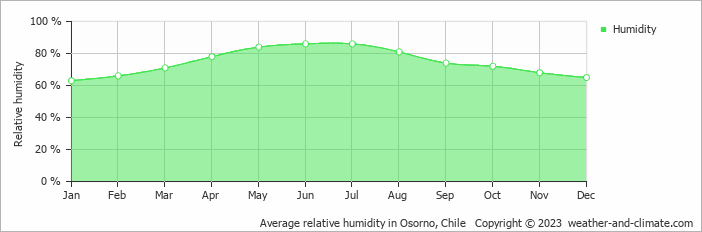
Average humidity
The relative humidity is high throughout the year in Ñilque.
The city experiences its highest humidity in June, reaching 86%. In January, the humidity drops to its lowest level at 63%. What does this mean? Read our detailed page on humidity levels for further details.
Relative humidity over the year
Forecast for Ñilque


Select a Month of Interest
Check the conditions for any month of the year.
The best time of year to visit Ñilque in Chile
The average rainfall figures in Ñilque are quite high. Throughout the year, you have a chance of prolonged precipitation. So no matter what time of year you go, you will always have to deal with a high number of rainy days. This makes it more challenging to point out the best time of year to visit. Other facts from our historical weather data:February has an average maximum temperature of 20°C and is the warmest month of the year.
The coldest month is July with an average maximum temperature of 8°C.
June tops the wettest month list with 471 mm of rainfall.
January is the driest month with 125 mm of precipitation.
No idea where to travel to this year? We have a tool that recommends destinations based on your ideal conditions. Find out where to go with our weather planner.


