Murlo Weather & Climate: Best Time to Visit
Murlo, Tuscany, Italy, experiences significant temperature variation throughout the year. Summers bring daytime highs of 31°C (88°F) in August, while winters cool to 10°C (50°F) in January.
Annual rain/snowfall is moderate at around 857 mm (34 in), with November being the wettest month. The city also has a distinct dry season from July to August. Sunshine peaks in July, when the city sees around 11.7 hours of sunshine per day.
Monthly Temperature in Murlo
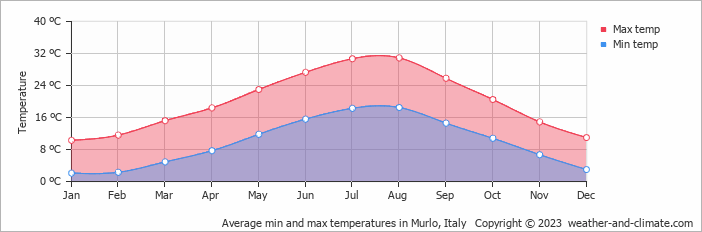
Depending on the time of the year, temperatures range from very warm to chilly in Murlo. Average daytime temperatures reach a very warm 31°C (88°F) in August. In January, the coolest month of the year, temperatures drop to a chilly 10°C (50°F).
At night, temperatures range from around 19°C (66°F) in August to 2°C (36°F) in January.Check out our detailed temperature page for more information.
Temperature ranges by month
Rainfall in Murlo
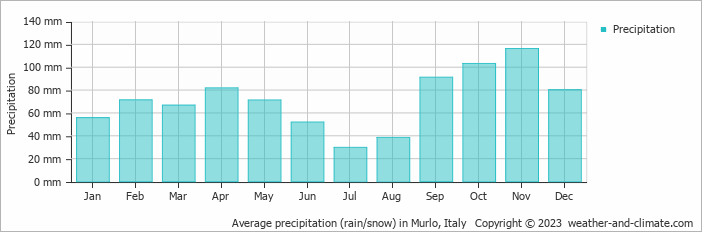
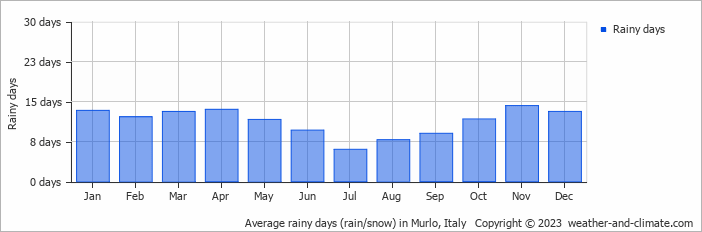
Generally, Murlo has a moderate amount of precipitation, averaging 857 mm (34 in) of rain/snowfall annually. Murlo can be quite wet during November, receiving approximately 116 mm (4.6 in) of precipitation over 14 rainy days.
In contrast, during the driest month (July), you will experience much drier conditions, with 30 mm (1.2 in) of precipitation spread across 6 rainy days days. For more details, please visit our Murlo Precipitation page.The mean monthly precipitation over the year, including rain, hail, and snow
The average number of days each month with precipitation
Sunshine Hours in Murlo
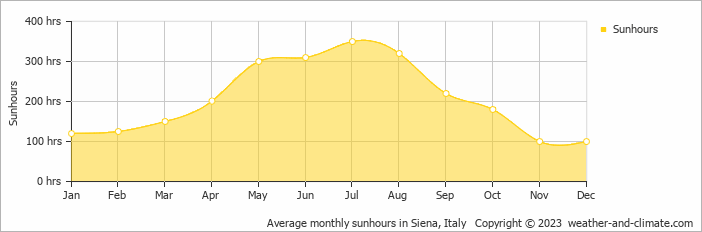
Murlo can be enjoyed more throughout the sunniest month of July under a blue sky, with approximately 11.7 hours of sunshine daily. In contrast, the city experiences much darker days in November, with only 3.3 hours of sunlight per day.
Visit our detailed sunshine hours page for more information.
Monthly hours of sunshine
Daily hours of sunshine
Murlo 3-Day Forecast
Check the conditions for any month of the year.
Best Time to Visit Murlo
During the months of April, May, June, September and October, Murlo enjoys pleasant weather with average temperatures ranging from 18°C (65°F) to 27°C (81°F). These months are perfect for sightseeing and exploring.Rainfall during this time ranges from 52 mm (2 in) in June to 103 mm (4.1 in) in October. This means you can expect a mix of sunny days and occasional showers. Planning your next adventure but unsure where to go? Our climate tool suggests perfect locations tailored to your preferred weather conditions. Discover your ideal travel destination with our weather planner.


