Masai Mara Weather & Climate: Best Time to Visit
Average temperatures, rainfall, sunshine and the best time to visit Masai Mara.
Climate overview of Masai Mara
The climate in Masai Mara, Kenya, is remarkably consistent, with temperatures year-round averaging 29°C (84°F). The warmest month is February at 30°C (86°F), and the coolest is July at 27°C (81°F).
The city receives around 770 mm (30 in) of rainfall per year. It experiences a distinct dry season from June to September. April is the wettest month and July the driest.
Masai Mara Weather by Month
Pick a month to see the average temperature, rainfall and sunshine in Masai Mara — and find the best time to visit.
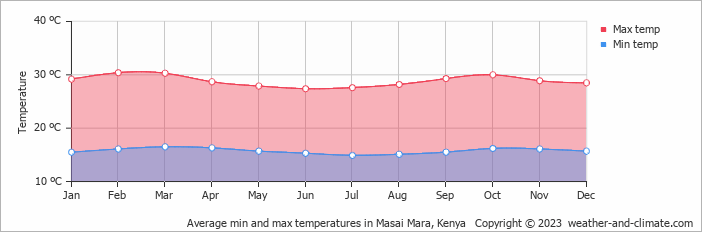
Monthly Temperature in Masai Mara
In Masai Mara temperatures are generally consistent throughout the year. On average, daytime temperatures range from a very warm 30°C (86°F) in February to a comfortable 27°C (81°F) in July.
Nighttime temperatures range from 17°C (63°F) in February to 15°C (59°F) in July.
Check out our detailed temperature page for more information.
Temperature ranges by month
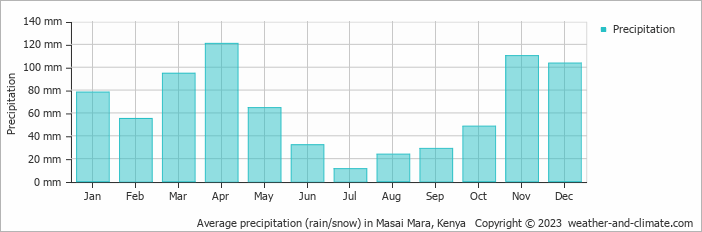
Rainfall in Masai Mara
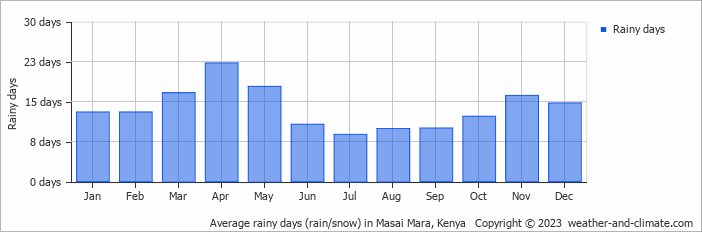
On average, Masai Mara receives a reasonable amount of rainfall, with an annual precipitation of 770 mm (30 in). The seasons in Masai Mara bring significant changes in precipitation. The wettest month, April, receives high rainfall, with an average of 121 mm (4.8 in) of precipitation. This rainfall is distributed across 22 rainy days.
In contrast, the driest month, July, experiences much less rainfall, totaling 11 mm (0.4 in) over 9 rainy days. These distinct seasonal differences provide diverse experiences throughout the year. For more details, please visit our Masai Mara Precipitation page.
The mean monthly precipitation over the year, including rain, hail, and snow
The average number of days each month with precipitation
Best Time to Visit Masai Mara
To make the most of your visit, consider exploring early in the morning or during the pleasant late afternoon hours when the temperature is most comfortable. Seeking the perfect travel destination for this year? We've created a tool that suggests locations matching your desired weather. Let our weather planner guide your travel decisions.
Frequently asked questions about the climate in Masai Mara
What is the best time to visit Masai Mara?
January, May, June, July, August and September typically offer the most optimal weather in Masai Mara. In contrast, February, March and October tend to have less optimal conditions. Masai Mara has a distinct dry season from June to September.
What temperatures can I expect in Masai Mara?
Daytime highs range from 27°C (81°F) in July to 30°C (86°F) in February. Nighttime lows range from 15°C (59°F) to 17°C (63°F). Temperatures stay relatively stable year-round.
How much rain does Masai Mara get?
Annual rainfall is around 770 mm (30 in). April is the wettest month with 121 mm (4.8 in), while July is the driest with 11 mm (0.4 in).
Masai Mara 3-Day Forecast
Masai Mara 3-Day Forecast
Masai Mara on the map
Masai Mara is highlighted — select any city to see its climate.
Popular this month
Where to go in June — average daytime high across popular destinations.
Bucket list
Need travel inspiration? Check out our bucket list articles and be inspired.
 The 10 best wildlife viewing sites in Kenya
Explore Kenya's top 10 safari parks in this guide, featuring the Maasai Mara, Amboseli, and more, for a spectacular wildlife adventure
Not on the map - Yoga Teacher Training in Kenya
A yoga training with the rawness of mother Africa. In a place so untouched we really are walking on the same earth elephants roamed not so long ago.
Tsavo National Park in Kenia
From mid-July to September and December to mid-March are the best months to visit both Tsavo National Parks. This park is a must see. The park is mountainous and green.