Marsa Matrouh Weather & Climate: Best Time to Visit
Average temperatures, rainfall, sunshine and the best time to visit Marsa Matrouh.
Climate overview of Marsa Matrouh
Marsa Matruh, in Egypt's Matruh Governorate, experiences significant temperature changes throughout the year. Very warm summers transition to pleasant winters, while the area sits in an arid zone with minimal rainfall year-round. People come to Marsa Matruh to enjoy beautiful Mediterranean beaches and escape Cairo's heat during the summer months. Let's now explore the climate details to provide you with a complete overview on when to visit.
Marsa Matrouh Weather by Month
Pick a month to see the average temperature, rainfall and sunshine in Marsa Matrouh — and find the best time to visit.
Monthly Temperature in Marsa Matrouh
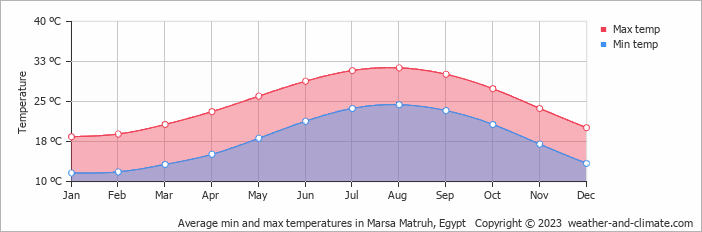
In Marsa Matrouh, temperatures differ significantly between summer and winter months. Average daytime temperatures reach a very warm 31°C (88°F) in August. In January, the coolest month of the year, temperatures drop to a pleasant 18°C (64°F).
At night, temperatures range from around 24°C (75°F) in August to 12°C (54°F) in January.
Check out our detailed temperature page for more information.
Temperature ranges by month
Rainfall in Marsa Matrouh
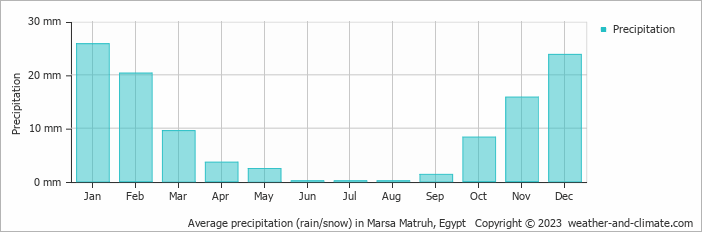
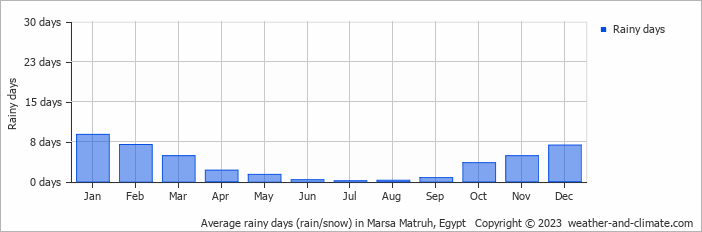
Marsa Matrouh sits in an arid zone with minimal moisture, averaging 111 mm (4.4 in) of rainfall per year. Marsa Matrouh can be quite wet during January, receiving approximately 26 mm (1 in) of precipitation over 9 rainy days.
In contrast, during the driest month (June), you will experience much drier conditions, with 0.1 mm (0 in) of precipitation spread across 0 rainy days days. For more details, please visit our Marsa Matrouh Precipitation page.
The mean monthly precipitation over the year, including rain, hail, and snow
The average number of days each month with precipitation
Sunshine Hours in Marsa Matrouh
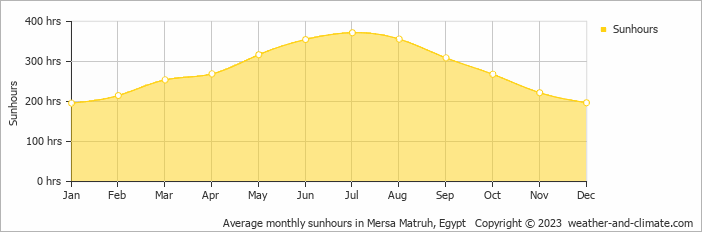
Marsa Matrouh can be enjoyed more throughout the sunniest month of July under a blue sky, with approximately 12.4 hours of sunshine daily. In contrast, the city experiences much darker days in January, with only 6.5 hours of sunlight per day.
Visit our detailed sunshine hours page for more information.
Monthly hours of sunshine
Daily hours of sunshine
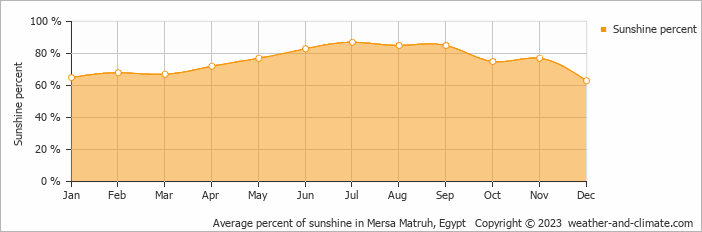
Daily percentage of sunshine
Water Temperature in Marsa Matrouh
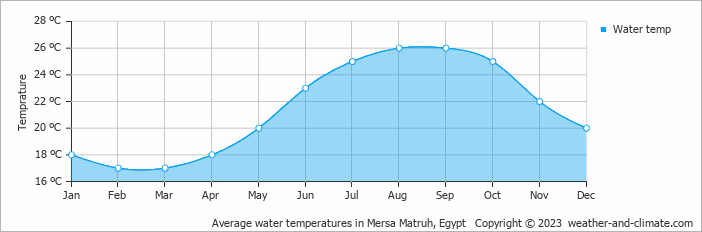
The mean water temperature over the year ranges from 17°C (63°F) in February to 26°C (79°F) in August.
Water temperature over the year
Humidity in Marsa Matrouh by Month
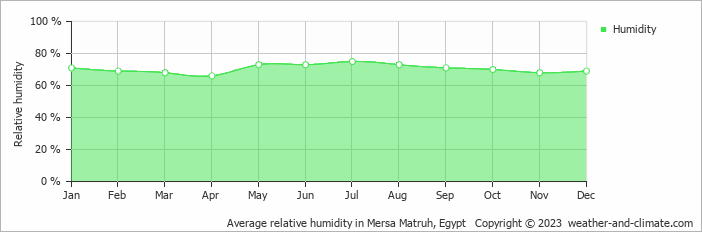
The relative humidity is high throughout the year in Marsa Matrouh.
The city experiences its highest humidity in July, reaching 75%. In April, the humidity drops to its lowest level at 66%. What does this mean? Read our detailed page on humidity levels for further details.
Relative humidity over the year
Wind Speed in Marsa Matrouh
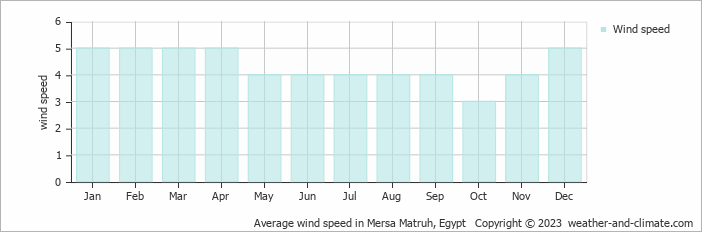
The mean wind speed varies between 3 m/s (6 knots) and 5 m/s (10 knots) throughout the year. It is lowest in October and highest during January, February, March, April and December. What does this mean?
The mean monthly wind speed over the year (meters per second)
Best Time to Visit Marsa Matrouh
While rain is rare, remember to stay hydrated and protect yourself from the sun while you're outside. Planning your next adventure but unsure where to go? Our climate tool suggests perfect locations tailored to your preferred weather conditions. Discover your ideal travel destination with our weather planner.
Frequently asked questions about the climate in Marsa Matrouh
What is the best time to visit Marsa Matrouh?
January, February, March, April, May, June, October, November and December typically offer the most optimal weather in Marsa Matrouh. In contrast, July, August and September tend to have less optimal conditions. Marsa Matrouh has a distinct dry season from January to December.
What temperatures can I expect in Marsa Matrouh?
Daytime highs range from 18°C (64°F) in January to 31°C (88°F) in August. Nighttime lows range from 12°C (54°F) to 24°C (75°F). Temperatures vary considerably through the year.
How much rain does Marsa Matrouh get?
Annual rainfall is around 111 mm (4.4 in). January is the wettest month with 26 mm (1 in), while June is the driest with 0.1 mm (0 in).
How sunny is Marsa Matrouh?
Marsa Matrouh receives around 3,330 hours of sunshine per year. July is the sunniest month with 372 hours, while January is the cloudiest with just 196 hours. Overall, Marsa Matrouh enjoys abundant sunshine.
Marsa Matrouh 3-Day Forecast
Marsa Matrouh 3-Day Forecast
Marsa Matrouh on the map
Marsa Matrouh is highlighted — select any city to see its climate.
Popular this month
Where to go in June — average daytime high across popular destinations.
Bucket list
Need travel inspiration? Check out our bucket list articles and be inspired.
 The Pyramids of Giza are impressive and absolutely worth a visit
The pyramids are considered to be one of the seven wonders of the world in ancient times and they are the only one that still exist and can be visited today.
The Sinai Peninsula: Nowhere on earth is as quiet as this place
The Sinai Peninsula has an extraordinary and enchanting landscape. The peace and space in this region is overwhelming. Nowhere on earth is as quiet as this place.
The Timeless Wonders of Luxor
Discover Luxor’s ancient marvels, from the grand Karnak temple and royal tombs of Thebes to the historic charm of the Old Winter Palace.