Kahawa Weather & Climate: Best Time to Visit
Average temperatures, rainfall, sunshine and the best time to visit Kahawa.
Climate overview of Kahawa
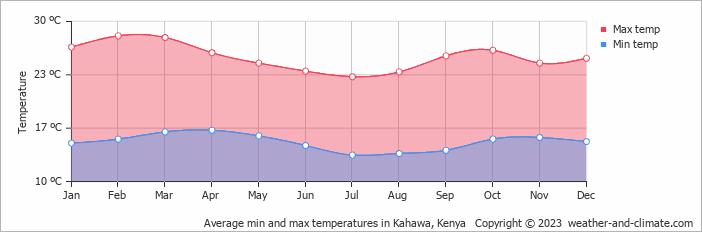
With consistently stable weather, Kahawa, Kenya, sees little seasonal temperature change. Daytime highs average 26°C (79°F), ranging from 28°C (82°F) in February to 23°C (73°F) in July.
Kahawa sees a moderate amount of rainfall, totalling around 775 mm (31 in) per year. It experiences a distinct dry season from July to September, creating some seasonal variation. The most sunshine falls in January, with an average of 9.6 hours of daily sunshine.
Kahawa Weather by Month
Pick a month to see the average temperature, rainfall and sunshine in Kahawa — and find the best time to visit.
Monthly Temperature in Kahawa
The climate in Kahawa remains fairly constant, offering comfortable temperatures throughout the year. Average maximum daytime temperatures range from a comfortable 28°C (82°F) in February, the warmest time of the year, to a comfortable 23°C (73°F) during cooler months like July.
At night, you can expect temperatures ranging from 16°C (61°F) in February to around 13°C (55°F) during July.
Check out our detailed temperature page for more information.
Temperature ranges by month
Rainfall in Kahawa
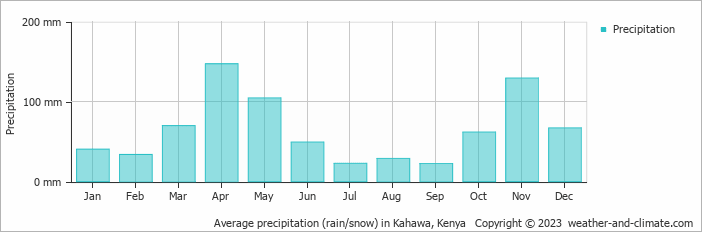
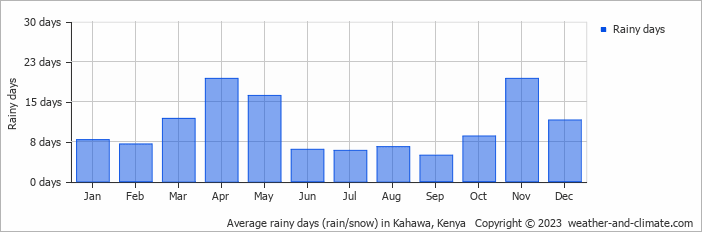
Generally, Kahawa experiences moderate precipitation patterns, averaging 775 mm (31 in) yearly. Significant seasonal changes in precipitation occur throughout the year. In the wettest month, April it receives high rainfall, averaging 147 mm (5.8 in) of precipitation, recorded across 19 rainy days. In contrast, the driest month September brings less rainfall, with 22 mm (0.9 in) over 5 rainy days. For more details, please visit our Kahawa Precipitation page.
The mean monthly precipitation over the year, including rain, hail, and snow
The average number of days each month with precipitation
Sunshine Hours in Kahawa
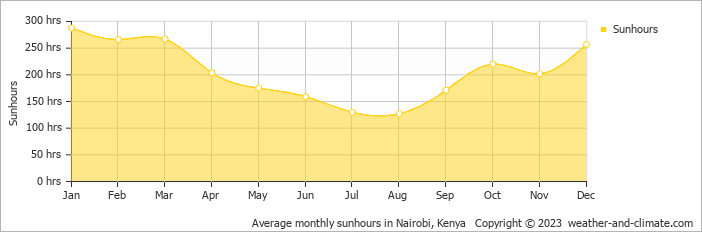
Seasonal changes in sunshine hours are quite dramatic in Kahawa. While January receives considerable daily sunshine with up to 9.6 hours, August marks the darkest time of the year, where sunshine is scarce with only 4.2 hours of sunlight per day.
Visit our detailed sunshine hours page for more information.
Monthly hours of sunshine
Daily hours of sunshine
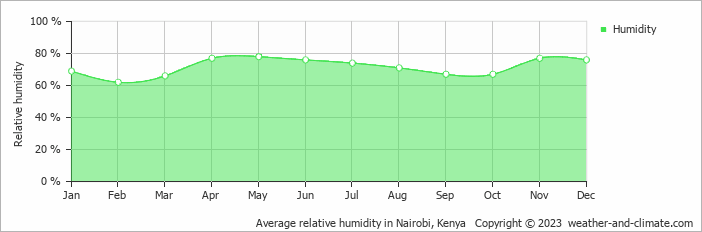
Humidity in Kahawa by Month
The relative humidity is high throughout the year in Kahawa.
The city experiences its highest humidity in May, reaching 78%. In February, the humidity drops to its lowest level at 62%. What does this mean? Read our detailed page on humidity levels for further details.
Relative humidity over the year
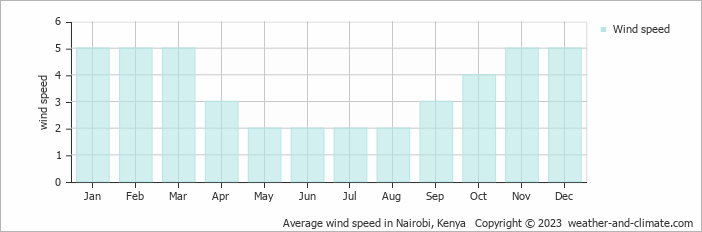
Wind Speed in Kahawa
The average wind speed over the year ranges from 2 m/s (4 knots) to 5 m/s (10 knots). It is lower in May, June, July and August and higher in January, February, March, November and December. What does this mean?
The mean monthly wind speed over the year (meters per second)
Best Time to Visit Kahawa
While you can visit anytime with confidence, the drier months like September (with just 22 mm (0.9 in) rainfall) provide the most favorable conditions for extended outdoor exploration and flexible itineraries. Need help choosing your next travel destination? We offer a specialized tool that matches you with locations based on your weather preferences. Explore destinations that suit your climate preferences.
Frequently asked questions about the climate in Kahawa
What is the best time to visit Kahawa?
January, February, March, June, July, August, September, October and December typically offer the most optimal weather in Kahawa. In contrast, April, May and November tend to have less optimal conditions. Kahawa has a distinct dry season from July to September.
What temperatures can I expect in Kahawa?
Daytime highs range from 23°C (73°F) in July to 28°C (82°F) in February. Nighttime lows range from 13°C (55°F) to 16°C (61°F). Temperatures stay relatively stable year-round.
How much rain does Kahawa get?
Annual rainfall is around 775 mm (31 in). April is the wettest month with 147 mm (5.8 in), while September is the driest with 22 mm (0.9 in).
How sunny is Kahawa?
Kahawa receives around 2,466 hours of sunshine per year. January is the sunniest month with 288 hours, while August is the cloudiest with just 127 hours. Overall, Kahawa enjoys abundant sunshine.
Kahawa 3-Day Forecast
Kahawa 3-Day Forecast
Kahawa on the map
Kahawa is highlighted — select any city to see its climate.
Popular this month
Where to go in June — average daytime high across popular destinations.
Bucket list
Need travel inspiration? Check out our bucket list articles and be inspired.
 The 10 best wildlife viewing sites in Kenya
Explore Kenya's top 10 safari parks in this guide, featuring the Maasai Mara, Amboseli, and more, for a spectacular wildlife adventure
Not on the map - Yoga Teacher Training in Kenya
A yoga training with the rawness of mother Africa. In a place so untouched we really are walking on the same earth elephants roamed not so long ago.
Tsavo National Park in Kenia
From mid-July to September and December to mid-March are the best months to visit both Tsavo National Parks. This park is a must see. The park is mountainous and green.