Chicxulub Weather & Climate: Best Time to Visit
The climate in Chicxulub, Yucatán, Mexico, is remarkably consistent, with temperatures year-round averaging 31°C (88°F). The warmest month is May at 34°C (93°F), and the coolest is January at 28°C (82°F).
The city receives around 639 mm (25 in) of rainfall per year. It experiences a distinct dry season from December to May. September is the wettest month and March the driest. Sunshine peaks in May, when the city sees around 9.2 hours of sunshine per day.
Monthly Temperature in Chicxulub
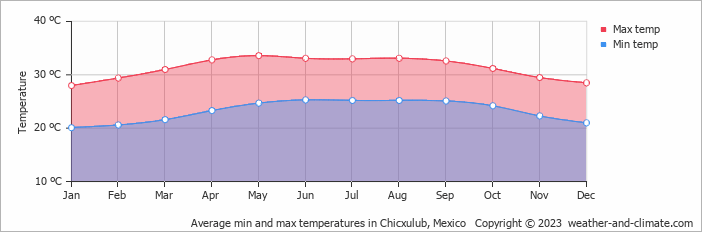
In Chicxulub temperatures are generally consistent throughout the year. On average, daytime temperatures range from a very warm 34°C (93°F) in May to a comfortable 28°C (82°F) in January.
Nighttime temperatures range from 25°C (77°F) in May to 20°C (68°F) in January.
Check out our detailed temperature page for more information.
Temperature ranges by month
Rainfall in Chicxulub
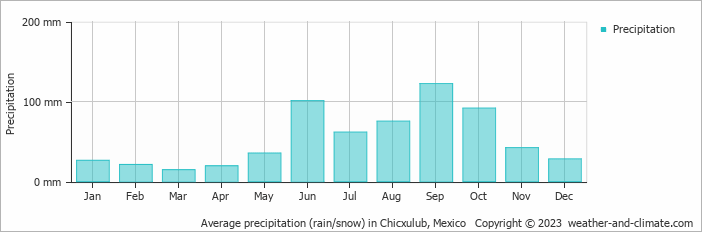
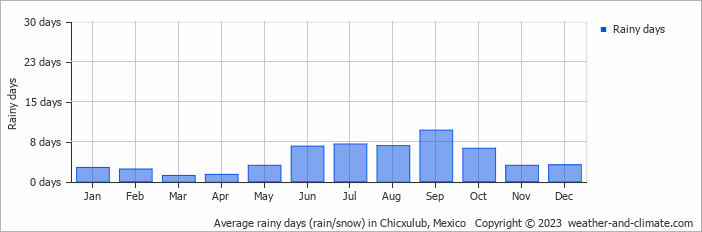
On average, Chicxulub receives a reasonable amount of rainfall, with an annual precipitation of 639 mm (25 in). The seasons in Chicxulub bring significant changes in precipitation. The wettest month, September, receives high rainfall, with an average of 122 mm (4.8 in) of precipitation. This rainfall is distributed across 10 rainy days.
In contrast, the driest month, March, experiences much less rainfall, totaling 15 mm (0.6 in) over a single rainy day. These distinct seasonal differences provide diverse experiences throughout the year. For more details, please visit our Chicxulub Precipitation page.
The mean monthly precipitation over the year, including rain, hail, and snow
The average number of days each month with precipitation
Sunshine Hours in Chicxulub
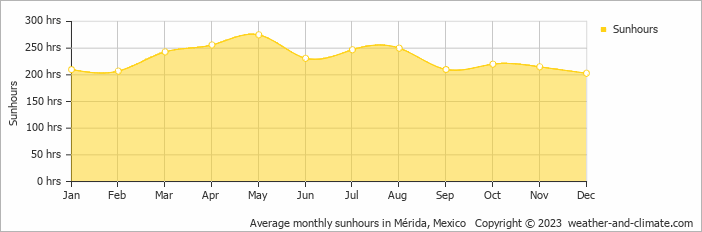
Chicxulub enjoys sunny spells year-round. May sees up to 9.2 hours of daily sunshine, perfect for a sunny trip. December, the least sunny month, still offers a generous 6.8 hours of sun despite this cloudier time of the year.
Visit our detailed sunshine hours page for more information.
Monthly hours of sunshine
Daily hours of sunshine
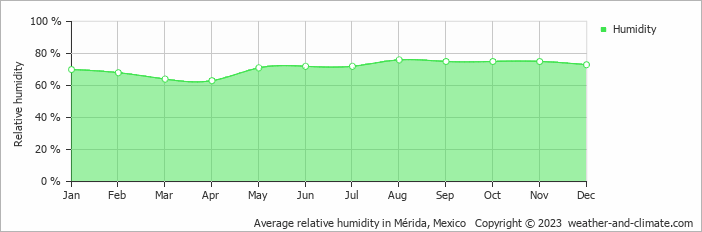
Humidity in Chicxulub by Month
The relative humidity is high throughout the year in Chicxulub.
The city experiences its highest humidity in August, reaching 76%. In April, the humidity drops to its lowest level at 63%. What does this mean? Read our detailed page on humidity levels for further details.
Relative humidity over the year
Chicxulub 3-Day Forecast
Check the conditions for any month of the year.
Best Time to Visit Chicxulub
The warm weather in Chicxulub maintains temperatures between 28°C (82°F) and 34°C (93°F) year-round. Plan your visit during January, February, March, April and December for drier days and the best conditions to enjoy being outside.To make the most of your visit, consider exploring early in the morning or during the pleasant late afternoon hours when the temperature is most comfortable. Need help choosing your next travel destination? We offer a specialized tool that matches you with locations based on your weather preferences. Explore destinations that suit your climate preferences.


