Chicxulub Temperature by Month
Chicxulub in Yucatán, Mexico enjoys a stable climate, with daytime temperatures staying close to 31°C (88°F) throughout the year. Explore the full monthly breakdown below.
Chicxulub Monthly Temperatures
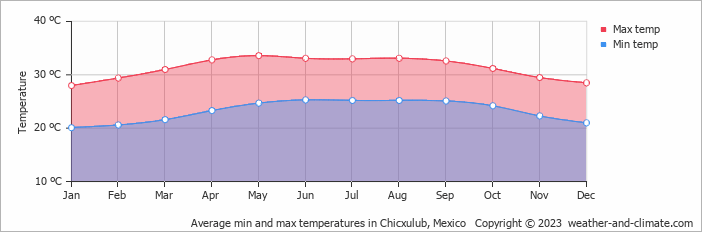
The temperature in Chicxulub changes very little across the seasons, maintaining a similar climate throughout the year. Maximum daytime temperatures range from a comfortable 28°C (82°F) in January to a very warm 34°C (93°F) in May. Nighttime lows range from 25°C (77°F) in May to 20°C (68°F) in January.
The chart below illustrates the average maximum day and minimum night temperatures in Chicxulub by month:
Daily lows are most common between 4 AM and 6 AM. By 3 PM temperatures reach their daily high, driven by peak solar heating. May, the warmest month of the year, receives 275 hours of sunshine.
The chart below shows the average temperature throughout the year:
Daily Historical Temperatures
Average high and low temperatures for each day of the month based on long-term records. 50-year average (1976-2025)
Average temperatures in July
Historical Chicxulub Temperatures: 1976-2026
Browse day-by-day temperature records for Chicxulub spanning 51 years. Select any month and year to see actual high and low temperatures recorded on each day.
Temperature: Chicxulub vs Mexico
The map below shows the annual temperature across Mexico. You can also select individual months if you want to compare a specific time of year.
Chicxulub vs World: Temperature Compared
Chicxulub's average annual maximum temperature is 31°C (88°F). To put that in context, here's how it compares to a few well-known destinations:
Barcelona, Spain has an annual average of around 21°C (70°F), with warm summers and mild, fairly short winters.
Toronto, Canada averages 13°C (55°F) annually, with cold snowy winters balanced by genuinely warm summers.
Seoul, South Korea averages 18°C (64°F) a year, with four clear seasons, cold winters, and hot humid summers.
Perth, Australia averages 25°C (77°F) annually, with a classic Mediterranean climate, hot dry summers and mild wet winters.
What Does the Temperature Feel Like in Chicxulub?
Temperature alone doesn't tell the whole story, humidity plays a big role in how warm or cold it actually feels. High humidity in summer makes the heat feel more intense, particularly once temperatures climb above 25°C. In winter, the same humidity can make cold air feel sharper than the thermometer suggests.
In Chicxulub, January is the coolest month, with average highs of 28°C (82°F) and humidity around 70%, considered high. In May, the warmest month, temperatures average 34°C (93°F) with 71% humidity, conditions that feel high. For a full picture, see our humidity page.
Climate temperature data is typically calculated as a 30-year average. This smooths out year-to-year variability and gives a more reliable picture of what a place is actually like, rather than what happened in any single unusual year.
The readings come from a range of sources, land-based weather stations, ocean buoys, ships, and satellites. That data is collected by weather services around the world, then pooled, quality-checked, and averaged to produce the climate records you see here.
Global average temperatures have risen by around 1.2°C since the pre-industrial era, and the effects are visible across many regions. Winters are milder on average, with fewer frost days and less snow in many parts of the world. Heatwaves are more frequent and more intense, and Europe's summers of 2018, 2019, and 2020 all set records.
Summers are also getting drier in some areas, while winter rainfall has increased in others. This contributies to higher river levels and more flooding. In many countries, spring arrives earlier and autumn lasts longer. It has knock-on effects for wildlife, agriculture, and local ecosystems.
For more on Chicxulub's weather, including monthly rainfall, sunshine hours, and humidity, visit our Chicxulub climate page.
Chicxulub Weather by Month
Pick a month to see the average temperature, rainfall and sunshine in Chicxulub - and find the best time to visit.
Chicxulub 3-Day Forecast
Temperature Rainfall Sunshine Humidity
See the full Chicxulub climate overview or explore weather in Mexico.
Popular this month
Where to go in July - average daytime high across popular destinations.
Bucket list
Need travel inspiration? Check out our bucket list articles and be inspired.
 Explore the Majestic Copper Canyons of Mexico
Explore the vast Copper Canyons in Chihuahua, Mexico—larger than the Grand Canyon. Discover scenic train rides, hikes, and the Tarahumara people.
These are the most beautiful Mayan ruins and Mayan temples in Mexico
Mexico is a destination where you can immerse yourself in ancient cultures and civilizations. In this article we have listed our favorite Mayan ruins.
Tips, to-do's and nicest restaurants in Mexico City
Mexico City, one of the most famous and notorious cities of the world. The best time to visit is between March and May, but it can be visited year round.
Zihuatanejo: A Pacific paradise with beautiful beaches
Zihuatanejo has some of Mexico's top beaches. Unlike other off-the-beaten-path destinations in Mexico, Zihua is very accessible and sustainable.