Ban Pong Weather and Climate: A Comprehensive Guide
The weather in Ban Pong is characterized by a steady average temperature throughout the year.
It also has a relatively rainy climate with high levels of precipitation.
Now, let’s explore all the climate details to give you a full picture.
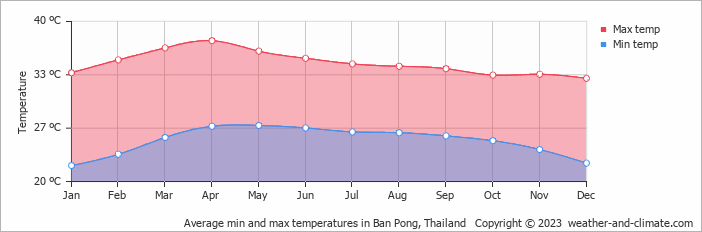
Average maximum day and minimum night temperature
With minimal seasonal shifts, Ban Pong experiences a constant climate year-round. On average, daytime temperatures range from a very hot 38°C in April to a very warm 33°C in January.
Nighttime temperatures can drop, with average lows reaching 22°C in January. Check out our detailed temperature page for more information.Temperature ranges by month
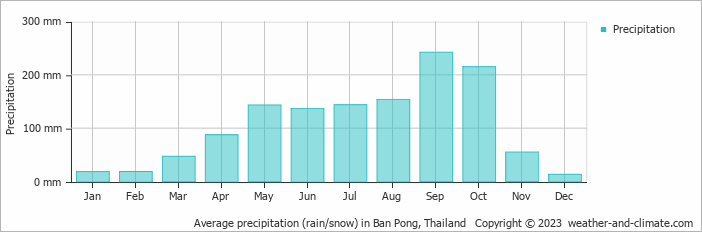
Precipitation and rainy days
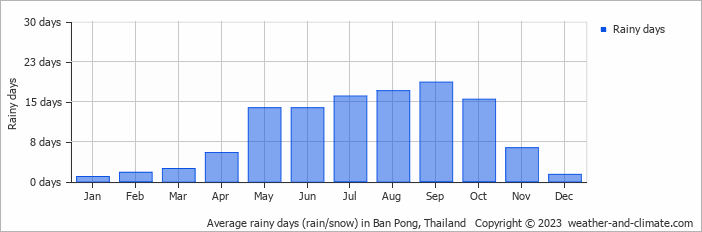
Ban Pong has a notably wet climate with abundant precipitation, recording 1272 mm of rainfall per year. The seasons in Ban Pong, bring significant changes in precipitation. The wettest month, September, receives heavy rainfall, with an average of 242 mm of precipitation. This rainfall is distributed across 19 rainy days. In contrast, the driest month, December, experiences much less rainfall, totaling 13 mm over a single rainy day. These distinct seasonal differences provide diverse experiences throughout the year. For more details, please visit our Ban Pong Precipitation page.The mean monthly precipitation over the year, including rain, hail and snow
The average number of days each month with precipitation
Sunshine over the year
In Ban Pong, summer days are longer and more sunny, with daily sunshine hours peaking at 8.8 hours in December. As the darker season arrives, the brightness of the sun becomes less. September sees a soft sun for only 3.6 hours per average day. Visit our detailed sunshine hours page for more information.Monthly hours of sunshine
Daily hours of sunshine
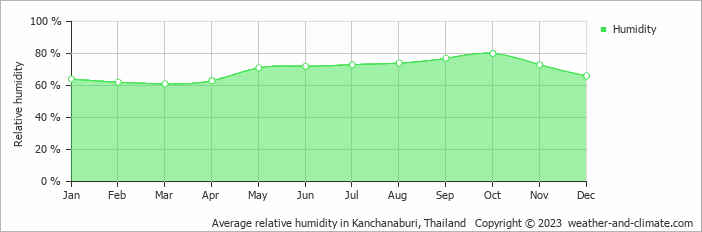
Average humidity
The relative humidity is high throughout the year in Ban Pong.
The city experiences its highest humidity in October, reaching 80%. In March, the humidity drops to its lowest level at 61%. What does this mean? Read our detailed page on humidity levels for further details.
Relative humidity over the year
almost clear and no rain almost clear and no rain almost clear and no rainForecast for Ban Pong
 4 m/s
4 m/s![]() 3 m/s
3 m/s![]() 3 m/s
3 m/s![]()
Select a Month of Interest
Check the conditions for any month of the year.
The best time of year to visit Ban Pong in Thailand
Other facts from our historical weather data:Most rainfall (rainy season) is seen in August, September and October.
Yes, the months of January, February and December are very dry.
April has an average maximum temperature of 38°C and is the hottest month of the year.
The coolest month is January with an average maximum temperature of 33°C.
September tops the wettest month list with 242 mm of rainfall.
December is the driest month with 13 mm of precipitation.
December is the sunniest month with an average of 263 hours of sunshine.
No idea where to travel to this year? We have a tool that recommends destinations based on your ideal conditions. Find out where to go with our weather planner.


