Hobart Weather & Climate: Best Time to Visit
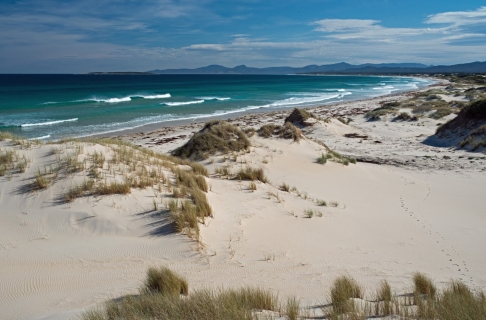
Hobart is the capital and largest city of Tasmania, an Australian island. Originally founded as a prison colony, the city has since grown into a vibrant cultural and historical center.
Hobart has a mild oceanic climate. In winter, temperatures can occasionally drop below freezing, and the peaks of Mount Wellington are often covered in snow. The city experiences the most snowfall in Australia and, after Melbourne, has the fewest average daily sunshine hours. Summers are mild, with average temperatures just above 20°C (68°F), though occasional heatwaves can push temperatures above 30°C (86°F). The highest recorded temperature exceeds 40°C (104°F).
During winter, winds typically blow from the south, bringing cold air from Antarctica.
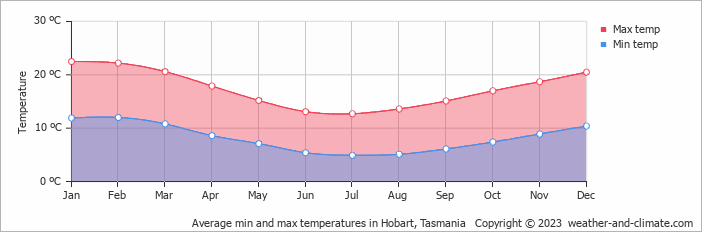
Monthly Temperature in Hobart
The weather in Hobart changes moderately throughout the year, offering enough variation to appreciate each season. On average, daytime temperatures range from a comfortable 23°C (73°F) in January to a moderate 13°C (55°F) in July.
Nighttime temperatures range from 12°C (54°F) in January to 5°C (41°F) in July.
Check out our detailed temperature page for more information.
Temperature ranges by month
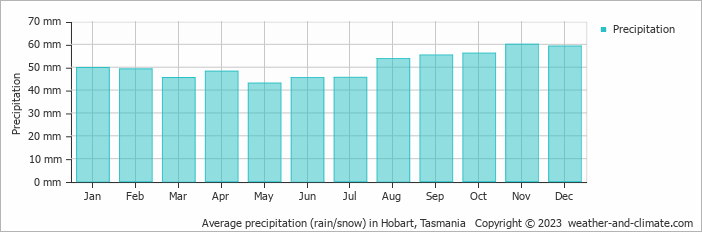
Rainfall in Hobart
On average, Hobart receives a reasonable amount of rainfall, with an annual precipitation of 611 mm (24 in). The wettest period in Hobart occurs in November, which receives around 60 mm (2.4 in) of precipitation. During the driest month, May, Hobart experiences moderate rainfall, totaling 43 mm (1.7 in). The consistent precipitation levels throughout the year contribute to a relatively stable climate. For more details, please visit our Hobart Precipitation page.
The mean monthly precipitation over the year, including rain, hail, and snow
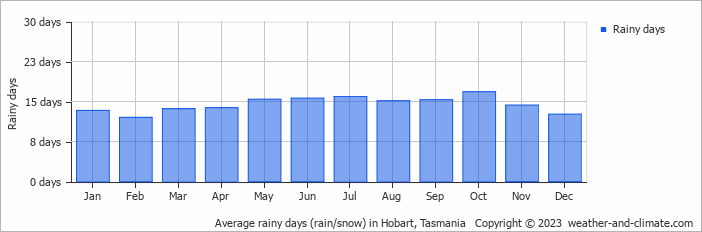
The average number of days each month with precipitation
Sunshine Hours in Hobart
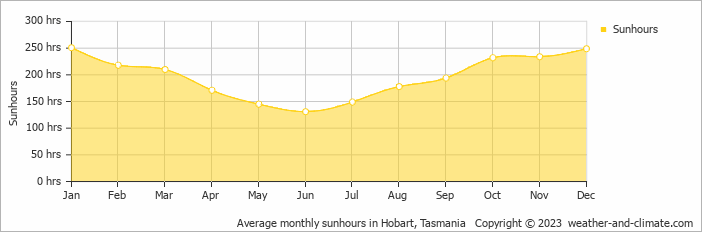
In Hobart, summer days are longer and more sunny, with daily sunshine hours peaking at 8.4 hours in January. As the darker season arrives, the brightness of the sun becomes less. June sees a soft sun for only 4.4 hours per average day.
Visit our detailed sunshine hours page for more information.
Monthly hours of sunshine
Daily hours of sunshine
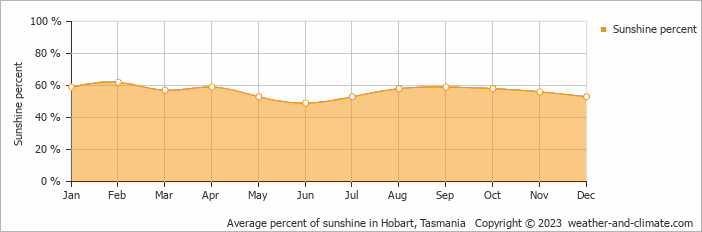
Daily percentage of sunshine
Water Temperature in Hobart
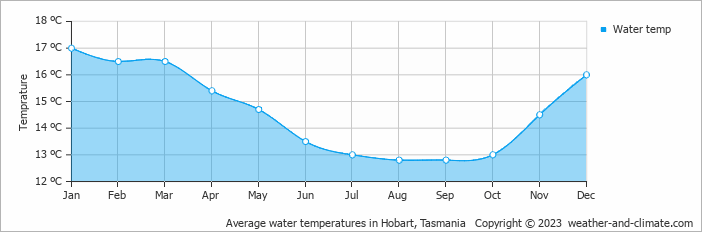
The mean water temperature over the year ranges from 13°C (55°F) in August to 17°C (63°F) in January.
Water temperature over the year
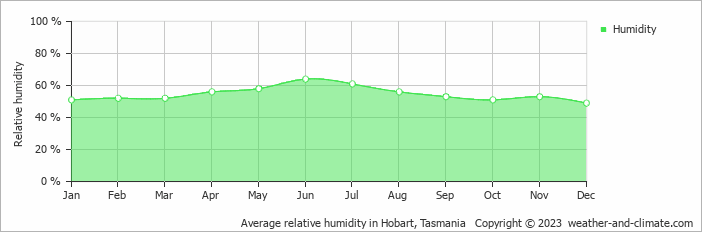
Humidity in Hobart by Month
The relative humidity is moderate throughout the year in Hobart.
The city experiences its highest humidity in June, reaching 64%. In December, the humidity drops to its lowest level at 49%. What does this mean? Read our detailed page on humidity levels for further details.
Relative humidity over the year
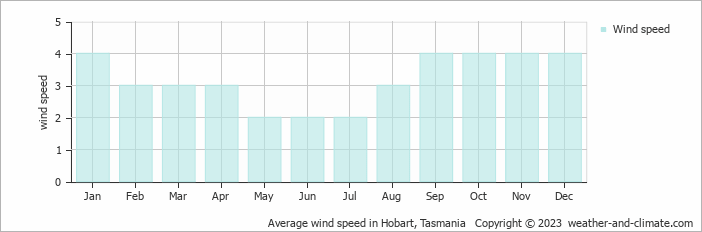
Wind Speed in Hobart
The mean wind speed varies between 2 m/s (4 knots) and 4 m/s (8 knots) throughout the year. It is lowest in May, June and July and highest during January, September, October, November and December. What does this mean?
The mean monthly wind speed over the year (meters per second)
Hobart 3-Day Forecast
Check the conditions for any month of the year.