Gabriola Island (BC) Weather & Climate: Best Time to Visit
Average temperatures, rainfall, sunshine and the best time to visit Gabriola Island.
Climate overview of Gabriola Island
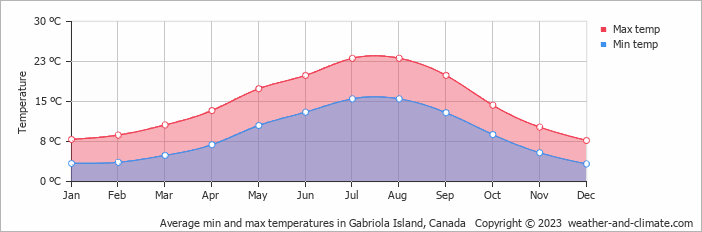
Temperatures in Gabriola Island, British Columbia, Canada, vary greatly throughout the year. July is the hottest month at 23°C (73°F), while December is the coldest at 8°C (46°F).
The city receives considerable rainfall, with around 1635 mm (64 in) annually. November is the wettest month. It has a distinct rainy season from November to January. July is the sunniest month, averaging 9.6 hours of sunshine per day.
Gabriola Island Weather by Month
Pick a month to see the average temperature, rainfall and sunshine in Gabriola Island — and find the best time to visit.
Monthly Temperature in Gabriola Island
The climate in Gabriola Island is known for significant temperature differences throughout the year, making the weather dynamic. Typically, average maximum daytime temperatures range from a comfortable 23°C (73°F) in July to a chilly 8°C (46°F) in the coolest month, December.
Nights vary from 16°C (61°F) in July to around 3°C (37°F) during the colder months.
Check out our detailed temperature page for more information.
Temperature ranges by month
Rainfall in Gabriola Island
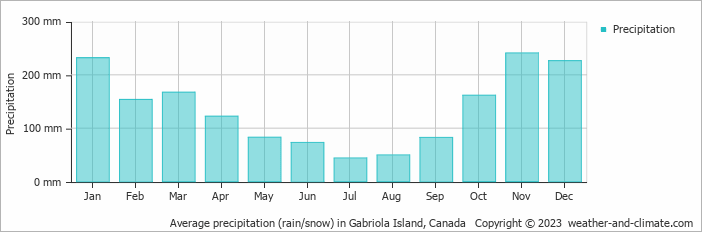
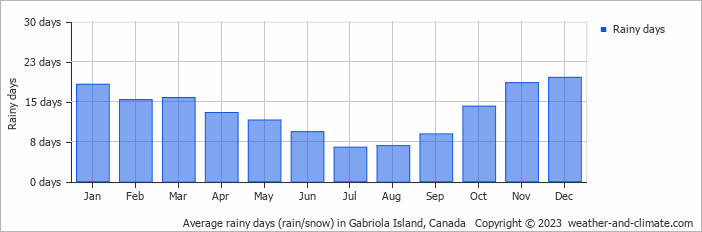
Gabriola Island has a notably wet climate with abundant precipitation, recording 1635 mm (64 in) of rainfall per year. The climate in Gabriola Island shows significant variation throughout the year. Expect heavy rainfall in November, the wettest month, with an average of 241 mm (9.5 in) of precipitation over 19 rainy days.
In contrast, the driest month July offers drier and sunnier days, with around 44 mm (1.7 in) of rainfall over 6 rainy days. For more details, please visit our Gabriola Island Precipitation page.
The mean monthly precipitation over the year, including rain, hail, and snow
The average number of days each month with precipitation
Sunshine Hours in Gabriola Island
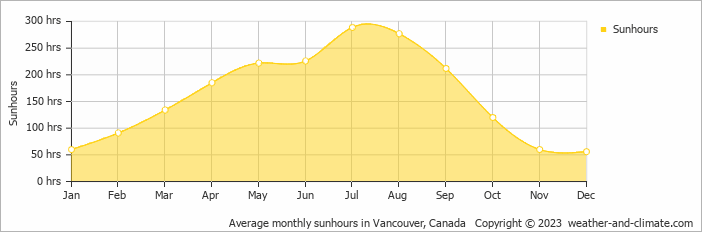
For those who appreciate different seasons, Gabriola Island serves as an ideal destination. Expect longer, more sun-filled days in July with an average of 9.6 hours of sunshine daily, and embrace the darker days in December, offering only 1.9 hours of daily sunlight.
Visit our detailed sunshine hours page for more information.
Monthly hours of sunshine
Daily hours of sunshine
Daily percentage of sunshine
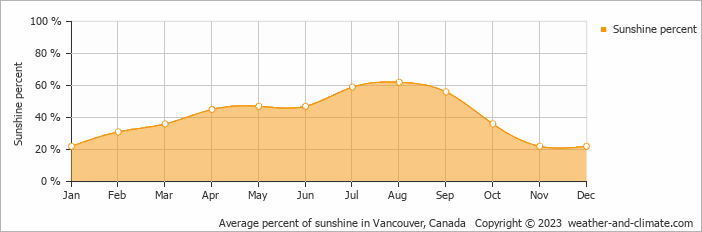
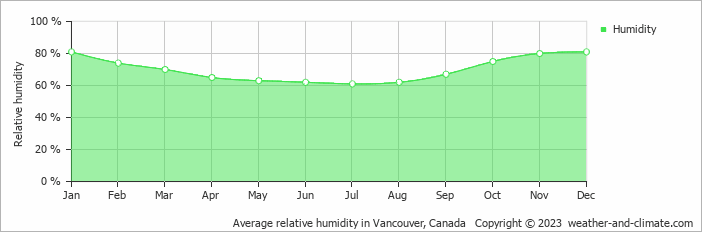
Humidity in Gabriola Island by Month
The relative humidity is high throughout the year in Gabriola Island.
The city experiences its highest humidity in January, reaching 81%. In July, the humidity drops to its lowest level at 61%. What does this mean? Read our detailed page on humidity levels for further details.
Relative humidity over the year
Best Time to Visit Gabriola Island
The wettest months are January, March, October, November and December, when precipitation is at its highest. Planning your next adventure but unsure where to go? Our climate tool suggests perfect locations tailored to your preferred weather conditions. Discover your ideal travel destination with our weather planner.
Frequently asked questions about the climate in Gabriola Island
What is the best time to visit Gabriola Island?
June, July, August and September typically offer the most optimal weather in Gabriola Island. In contrast, January, February, March, April, November and December tend to have less optimal conditions. Gabriola Island has a distinct rainy season from November to January.
What temperatures can I expect in Gabriola Island?
Daytime highs range from 8°C (46°F) in December to 23°C (73°F) in July. Nighttime lows range from 3°C (37°F) to 16°C (61°F). Temperatures vary considerably through the year.
How much rain does Gabriola Island get?
Annual rainfall is around 1635 mm (64 in). November is the wettest month with 241 mm (9.5 in), while July is the driest with 44 mm (1.7 in).
How sunny is Gabriola Island?
Gabriola Island receives around 1,932 hours of sunshine per year. July is the sunniest month with 289 hours, while December is the cloudiest with just 56 hours.
Gabriola Island 3-Day Forecast
Gabriola Island (BC) 3-Day Forecast
Gabriola Island on the map
Gabriola Island is highlighted — select any city to see its climate.
Popular this month
Where to go in June — average daytime high across popular destinations.
Bucket list
Need travel inspiration? Check out our bucket list articles and be inspired.
 The 5 most beautiful lakes in Canada
Explore Canada's stunning lakes: Lake Louise, Lake Superior, Maligne Lake, Emerald Lake, and Lake Okanagan, each offering unique beauty and activities.
Canoeing the south Nahannii
The South Nahanni in the northwest of Canada is one of the most impressive wilderness rivers in the world. Canoeing the south Nahanni is something you must add to your bucket list.
See Polar Bears in Churchill Canada
Thousands of bears gather at the small town of Churchill. In the evening the northern lights give a light show against the dark evening sky. An unforgettable experience.
Banff National Park
Snowy mountains, clear blue lakes and green forests make Banff National Park a wonderful bucket list destination. The pristine wilderness is a mecca for walkers.