El Tor Weather & Climate: Best Time to Visit
The climate in El Tor, Egypt, is marked by large temperature swings across the seasons, ranging from 35°C (95°F) in August to 20°C (68°F) in January.
The area sees almost no rainfall, totalling just 12 mm (0.5 in) per year.
Monthly Temperature in El Tor
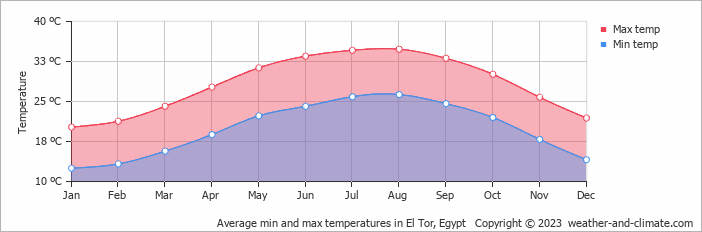
In El Tor, temperatures differ significantly between summer and winter months. Typically, average maximum daytime temperatures range from a very warm 35°C (95°F) in August to a pleasant 20°C (68°F) in the coolest month, January.
Nights vary from 26°C (79°F) in August to around 13°C (55°F) during the colder months.
Check out our detailed temperature page for more information.
Temperature ranges by month
Rainfall in El Tor
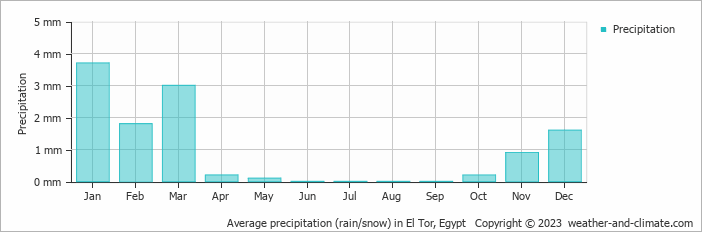
El Tor sits in an arid zone with minimal moisture, averaging 12 mm (0.5 in) of rainfall per year. Precipitation levels in El Tor remain relatively steady throughout the year. January has the most rain, with 3.7 mm (0.1 in) over a single day. In the driest month June, this drops slightly to 0 mm (0 in), making the city's climate fairly predictable. For more details, please visit our El Tor Precipitation page.
The mean monthly precipitation over the year, including rain, hail, and snow
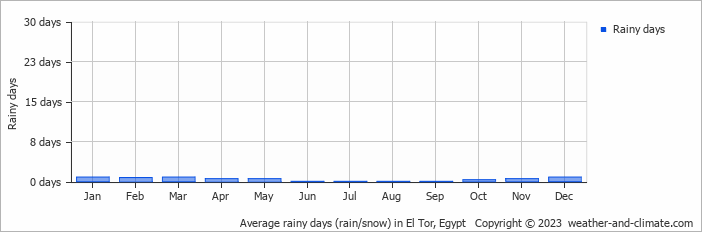
The average number of days each month with precipitation
Humidity in El Tor by Month
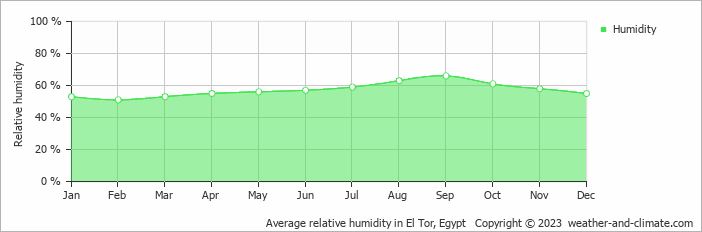
The relative humidity is moderate throughout the year in El Tor.
The city experiences its highest humidity in September, reaching 66%. In February, the humidity drops to its lowest level at 51%. What does this mean? Read our detailed page on humidity levels for further details.
Relative humidity over the year
Wind Speed in El Tor
The mean wind speed over the year ranges from () in January, February, March, April, May, June, July, August, September, October, November and December to () in January, February, March, April, May, June, July, August, September, October, November and December. What does this mean?
The mean monthly wind speed over the year (meters per second)
El Tor 3-Day Forecast
Check the conditions for any month of the year.
Best Time to Visit El Tor
The best time to visit El Tor is during January, February, March, April, November and December, when the dry conditions provide ideal temperatures between 20°C (68°F) and 28°C (82°F). With minimal rainfall throughout the year, you can expect consistently clear, sunny days.While rain is rare, remember to stay hydrated and protect yourself from the sun while you're outside. Wondering where to travel based on your weather preferences? Our recommendation tool helps you find destinations with your ideal climate conditions. Use our weather planner to find your perfect destination.