ClimateForecastAprilMay >>

Climate in Hatillo (North Puerto Rico), Puerto Rico

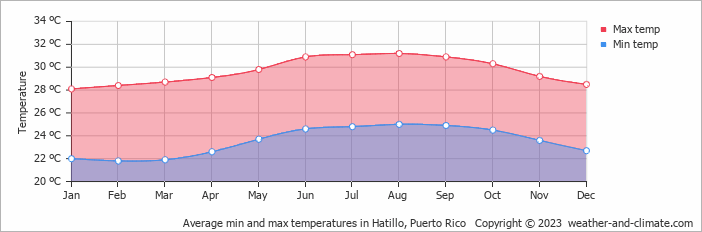
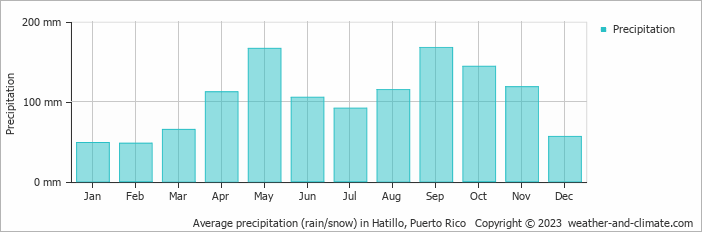
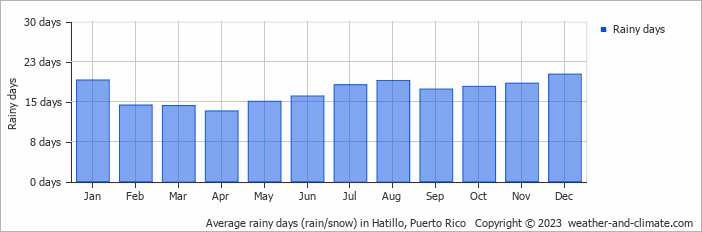
The graphs below show the monthly weather averages over the year.

Average day and night temperature

The mean minimum and maximum temperatures over the year.

Average monthly minimum and maximum temperature in Hatillo, Puerto Rico

Feel free to add this climate graph to your website. Click the copy button above.

Monthly precipitation

The mean monthly precipitation over the year, including rain, snow, hail etc.

Average monthly rainfall, snow, precipitation in Hatillo, Puerto Rico

Feel free to add this climate graph to your website. Click the copy button above.

Monthly rainy days

The average number of days each month with rain, snow, hail etc.

Average monthly rainy days in Hatillo, Puerto Rico

Feel free to add this climate graph to your website. Click the copy button above.

Weather Forecasts for Hatillo

Tue   Apr 16
29°C | 23°C
E 18 km/h
6.1 mm
partly cloudy and thunder

partly cloudy and thunder

Wed   Apr 17
29°C | 22°C
SE 11 km/h
6.9 mm
partly cloudy and thunder

partly cloudy and thunder

Thu   Apr 18
29°C | 23°C
NE 11 km/h
1.1 mm
partly cloudy and rain

partly cloudy and rain

The best time of year to visit Hatillo in Puerto Rico

Other facts from our historical weather data:

  • Which months have the greatest rainfall in Hatillo?
    Most rainfall (rainy season) is seen in May and September.
  • Which is the hottest month in Hatillo?
    August has an average maximum temperature of 31°C and is the hottest month of the year.
  • Which is the coolest month in Hatillo?
    The coolest month is February with an average maximum temperature of 28°C.
  • Which is the wettest month in Hatillo?
    September tops the wettest month list with 167 mm of rainfall.
  • Which is the driest month in Hatillo?
    February is the driest month with 48 mm of precipitation.

  • No idea where to travel to this year? We have a tool that recommends destinations based on your ideal conditions. Find out where to go with our weather planner.