San Juan Weather & Climate: Best Time to Visit
Average temperatures, rainfall, sunshine and the best time to visit San Juan.
Climate overview of San Juan
Because of it's high temperatures with a lot of precepation the humidity can be pretty high,but because of the nice sea breeze you won't experience it as too hot.
San Juan Weather by Month
Pick a month to see the average temperature, rainfall and sunshine in San Juan — and find the best time to visit.
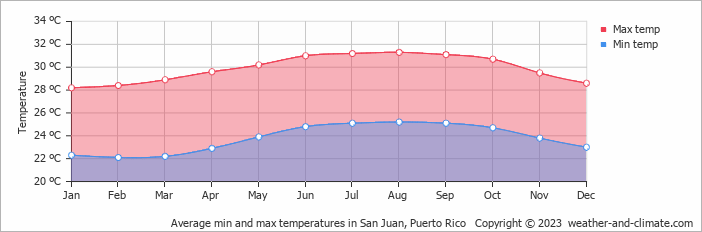
Monthly Temperature in San Juan
The temperature in San Juan remains steady throughout the year, providing a consistently very warm climate. Average maximum daytime temperatures range from a very warm 31°C (88°F) in August, the warmest time of the year, to a comfortable 28°C (82°F) during cooler months like February.
At night, you can expect temperatures ranging from 25°C (77°F) in August to around 22°C (72°F) during February.
Check out our detailed temperature page for more information.
Temperature ranges by month
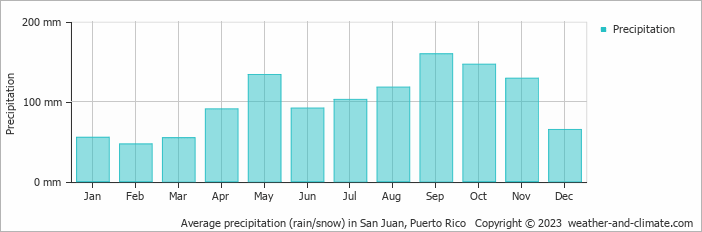
Rainfall in San Juan
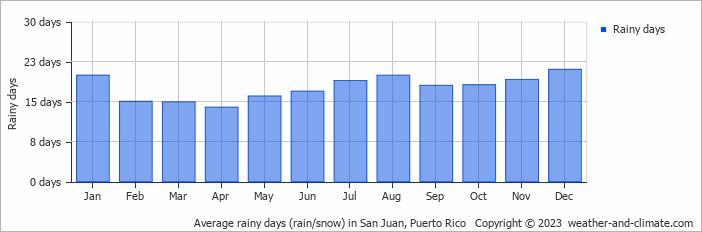
San Juan has a relatively rainy climate with high precipitation levels, averaging 1192 mm (47 in) of rainfall annually. Significant seasonal changes in precipitation occur throughout the year. In the wettest month, September it receives high rainfall, averaging 159 mm (6.3 in) of precipitation, recorded across 18 rainy days. In contrast, the driest month February brings less rainfall, with 47 mm (1.9 in) over 15 rainy days. For more details, please visit our San Juan Precipitation page.
The mean monthly precipitation over the year, including rain, hail, and snow
The average number of days each month with precipitation
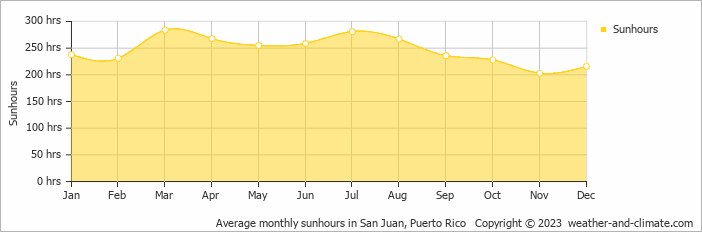
Sunshine Hours in San Juan
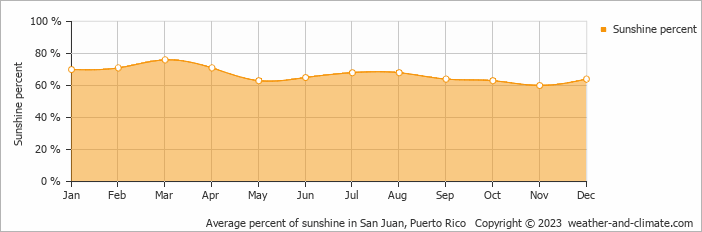
While the amount of sunshine in San Juan varies throughout the year, all seasons offer their own charm. Enjoy up to 9.5 hours of daily sun in March, and experience slightly darker atmosphere in November, with about 6.8 hours of daily sunlight.
Visit our detailed sunshine hours page for more information.
Monthly hours of sunshine
Daily hours of sunshine
Daily percentage of sunshine
Water Temperature in San Juan
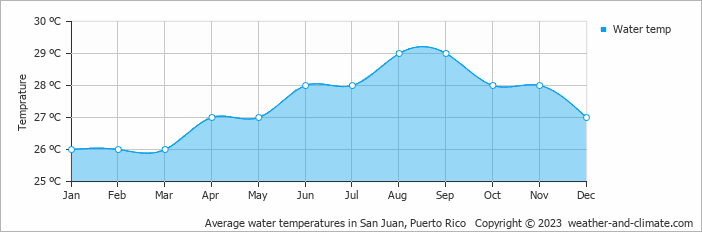
The mean water temperature over the year ranges from 26°C (79°F) in January to 29°C (84°F) in August.
Water temperature over the year
Humidity in San Juan by Month
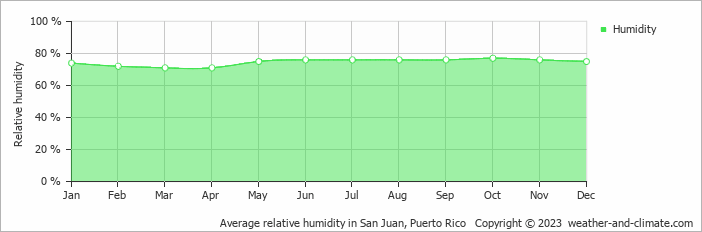
The relative humidity is high throughout the year in San Juan.
The city experiences its highest humidity in October, reaching 77%. In March, the humidity drops to its lowest level at 71%. What does this mean? Read our detailed page on humidity levels for further details.
Relative humidity over the year
Wind Speed in San Juan
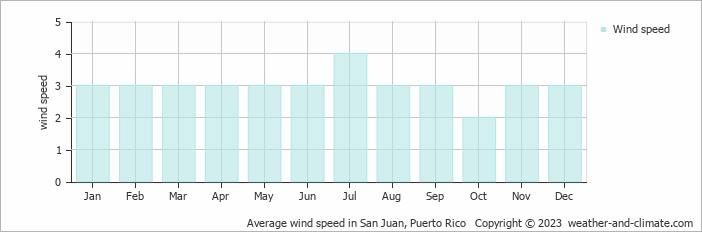
The mean wind speed over the year ranges from 2 m/s (4 knots) in October to 4 m/s (8 knots) in July. What does this mean?
The mean monthly wind speed over the year (meters per second)
Best Time to Visit San Juan
For a more comfortable experience, start your day early when the weather is cooler, or take advantage of the gentle breezes in the late afternoon. Need help choosing your next travel destination? We offer a specialized tool that matches you with locations based on your weather preferences. Explore destinations that suit your climate preferences.
Frequently asked questions about the climate in San Juan
What is the best time to visit San Juan?
January, February, March and December typically offer the most optimal weather in San Juan. In contrast, May, July, August, September, October and November tend to have less optimal conditions.
What temperatures can I expect in San Juan?
Daytime highs range from 28°C (82°F) in February to 31°C (88°F) in August. Nighttime lows range from 22°C (72°F) to 25°C (77°F). Temperatures stay relatively stable year-round.
How much rain does San Juan get?
Annual rainfall is around 1192 mm (47 in). September is the wettest month with 159 mm (6.3 in), while February is the driest with 47 mm (1.9 in).
How sunny is San Juan?
San Juan receives around 2,966 hours of sunshine per year. March is the sunniest month with 284 hours, while November is the cloudiest with just 203 hours. Overall, San Juan enjoys abundant sunshine.
San Juan 3-Day Forecast
San Juan 3-Day Forecast
San Juan on the map
San Juan is highlighted — select any city to see its climate.
Popular this month
Where to go in June — average daytime high across popular destinations.