Fajardo Weather & Climate: Best Time to Visit
Average temperatures, rainfall, sunshine and the best time to visit Fajardo.
Climate overview of Fajardo
Fajardo, Puerto Rico, enjoys a steady climate throughout the year, with daytime temperatures typically around 29°C (84°F). September is the warmest month at 30°C (86°F), while February is the coolest at 27°C (81°F).
With around 1388 mm (55 in) of annual rainfall, Fajardo has a notably wet climate. The wettest month is September. The most sunshine falls in March, with an average of 9.5 hours of daily sunshine.
Fajardo Weather by Month
Pick a month to see the average temperature, rainfall and sunshine in Fajardo - and find the best time to visit.
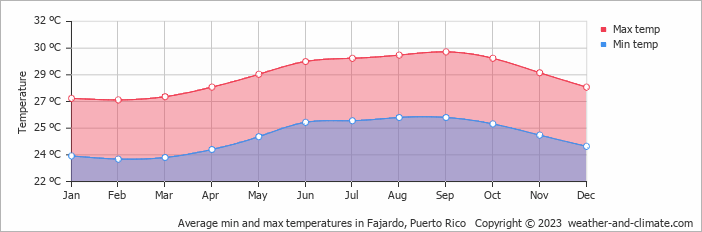
Monthly Temperature in Fajardo
The temperature in Fajardo remains steady throughout the year, providing a consistently very warm climate. Average daytime temperatures reach a very warm 30°C (86°F) in September. In February, the coolest month of the year, temperatures drop to a comfortable 27°C (81°F).
At night, temperatures range from around 26°C (79°F) in September to 23°C (73°F) in February.
Check out our detailed temperature page for more information.
Temperature ranges by month
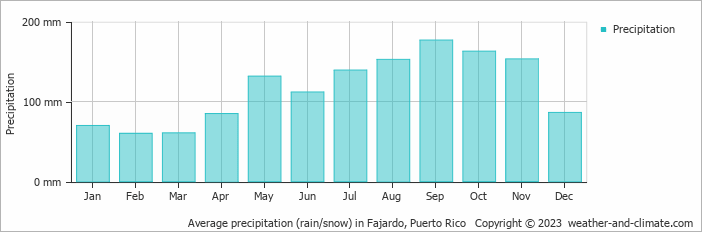
Rainfall in Fajardo
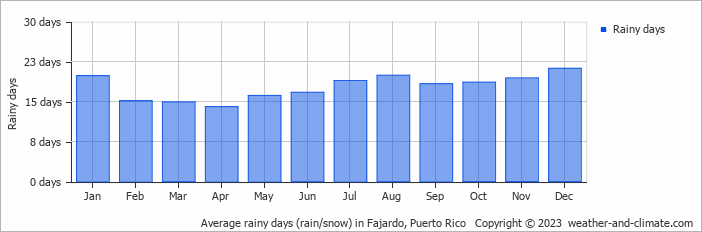
Fajardo has a relatively rainy climate with high precipitation levels, averaging 1388 mm (55 in) of rainfall annually. Fajardo can be quite wet during September, receiving approximately 177 mm (7 in) of precipitation over 18 rainy days.
In contrast, during the driest month (February), you will experience much drier conditions, with 60 mm (2.4 in) of precipitation spread across 15 rainy days. For more details, please visit our Fajardo Precipitation page.
The mean monthly precipitation over the year, including rain, hail, and snow
The average number of days each month with precipitation
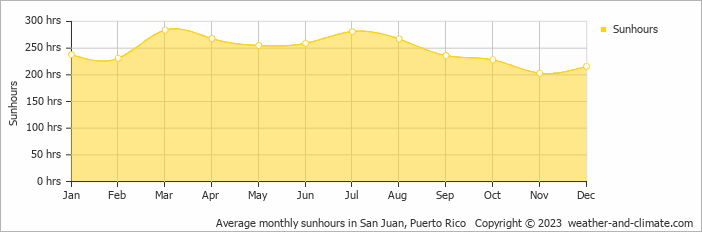
Sunshine Hours in Fajardo
Fajardo experiences moderate variation in sunshine hours across the seasons. With 9.5 hours daily sunshine in March, it dips to 6.8 hours in November, offering a balanced mix of sunny and overcast days.
Visit our detailed sunshine hours page for more information.
Monthly hours of sunshine
Daily hours of sunshine
Daily percentage of sunshine
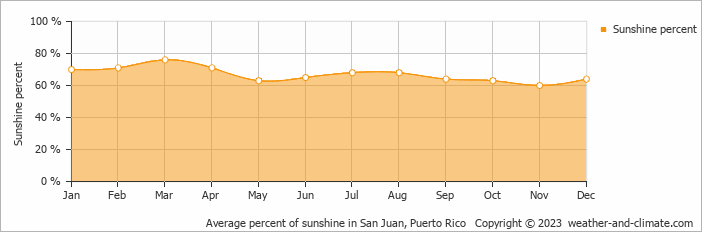
Humidity in Fajardo by Month
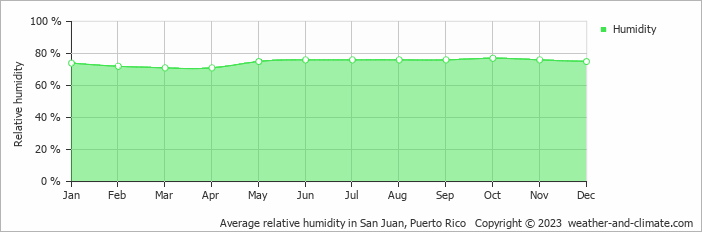
The relative humidity is high throughout the year in Fajardo.
The city experiences its highest humidity in October, reaching 77%. In March, the humidity drops to its lowest level at 71%. What does this mean? Read our detailed page on humidity levels for further details.
Relative humidity over the year
Best Time to Visit Fajardo
Monthly ratings reflect general weather comfort, based on daytime temperature and rainfall. Swimming and winter conditions are highlighted separately where relevant.
- Best overall: January, February, March, April and December
- Warmest weather: May, June, July, August, September, October and November
- Most sunshine: March and July
- Fewer rainy days: February, March, April, May and June
Frequently asked questions about the climate in Fajardo
What is the best time to visit Fajardo?
January, February, March, April and December typically offer the most optimal weather in Fajardo. In contrast, June, July, August, September and October tend to have less optimal conditions.
What temperatures can I expect in Fajardo?
Daytime highs range from 27°C (81°F) in February to 30°C (86°F) in September. Nighttime lows range from 23°C (73°F) to 26°C (79°F). Temperatures stay relatively stable year-round.
How much rain does Fajardo get?
Annual rainfall is around 1388 mm (55 in). September is the wettest month with 177 mm (7 in), while February is the driest with 60 mm (2.4 in).
How sunny is Fajardo?
Fajardo receives around 2,966 hours of sunshine per year. March is the sunniest month with 284 hours, while November is the cloudiest with just 203 hours. Overall, Fajardo enjoys abundant sunshine.
Fajardo 3-Day Forecast
Fajardo 3-Day Forecast
Fajardo on the map
Fajardo is highlighted - select any city to see its climate.
Popular this month
Where to go in July - average daytime high across popular destinations.