Rio Grande Weather & Climate: Best Time to Visit
Rio Grande, Puerto Rico, enjoys a steady climate throughout the year, with daytime temperatures typically around 29°C (84°F). August is the warmest month at 31°C (88°F), while February is the coolest at 28°C (82°F).
With around 1300 mm (51 in) of annual rainfall, Rio Grande has a notably wet climate. The wettest month is September. The sunniest month is March, with 9.5 hours of sunshine per day on average.
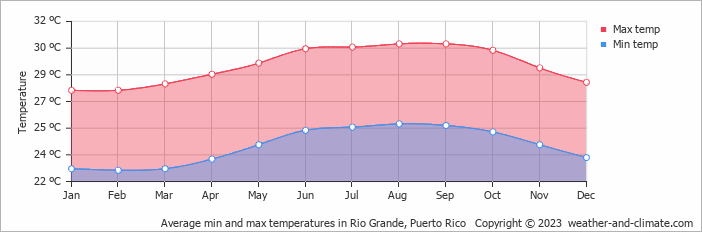
Monthly Temperature in Rio Grande
The temperature in Rio Grande remains steady throughout the year, providing a consistently very warm climate. Average daytime temperatures reach a very warm 31°C (88°F) in August. In February, the coolest month of the year, temperatures drop to a comfortable 28°C (82°F).
At night, temperatures range from around 26°C (79°F) in August to 23°C (73°F) in February.
Check out our detailed temperature page for more information.
Temperature ranges by month
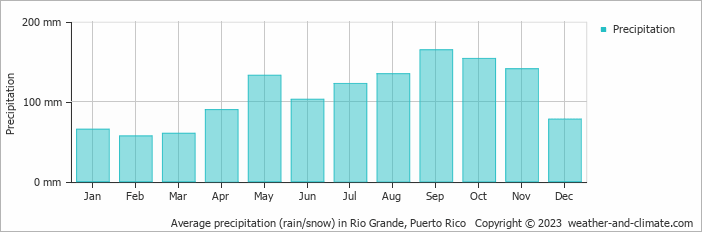
Rainfall in Rio Grande
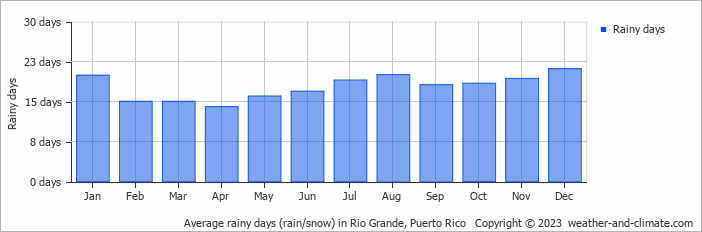
Rio Grande has a relatively rainy climate with high precipitation levels, averaging 1300 mm (51 in) of rainfall annually. Rio Grande can be quite wet during September, receiving approximately 164 mm (6.5 in) of precipitation over 18 rainy days.
In contrast, during the driest month (February), you will experience much drier conditions, with 57 mm (2.2 in) of precipitation spread across 15 rainy days days. For more details, please visit our Rio Grande Precipitation page.
The mean monthly precipitation over the year, including rain, hail, and snow
The average number of days each month with precipitation
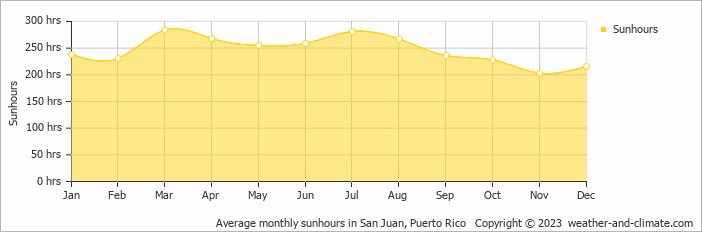
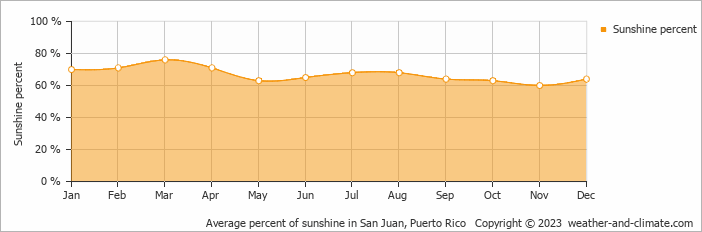
Sunshine Hours in Rio Grande
Rio Grande experiences moderate variation in sunshine hours across the seasons. With 9.5 hours daily sunshine in March, it dips to 6.8 hours in November, offering a balanced mix of sunny and overcast days.
Visit our detailed sunshine hours page for more information.
Monthly hours of sunshine
Daily hours of sunshine
Daily percentage of sunshine
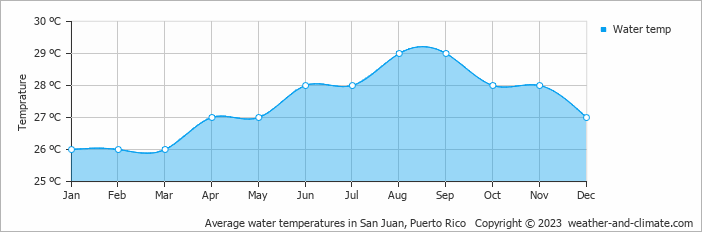
Water Temperature in Rio Grande
The mean water temperature over the year ranges from 26°C (79°F) in January to 29°C (84°F) in August.
Water temperature over the year
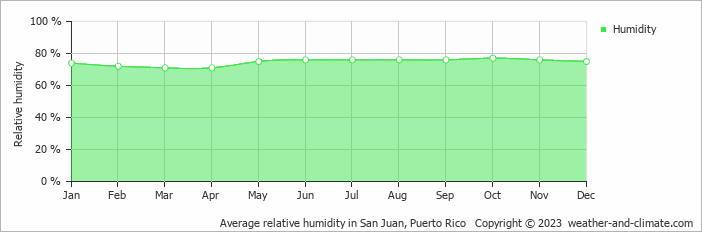
Humidity in Rio Grande by Month
The relative humidity is high throughout the year in Rio Grande.
The city experiences its highest humidity in October, reaching 77%. In March, the humidity drops to its lowest level at 71%. What does this mean? Read our detailed page on humidity levels for further details.
Relative humidity over the year
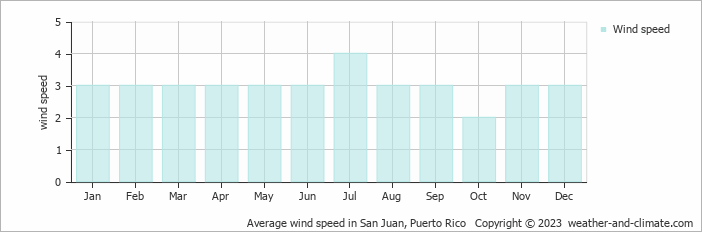
Wind Speed in Rio Grande
The average wind speed over the year ranges from 2 m/s (4 knots) to 4 m/s (8 knots). It is lower in October and higher in July. What does this mean?
The mean monthly wind speed over the year (meters per second)
Rio Grande 3-Day Forecast
Check the conditions for any month of the year.
Best Time to Visit Rio Grande
Rio Grande has warm weather with temperatures ranging from 28°C (82°F) to 31°C (88°F) throughout the year. The best time to visit is during February, when rainfall is at its lowest, making it a great time for sightseeing and exploring all the place has to offer.For a more comfortable experience, start your day early when the weather is cooler, or take advantage of the gentle breezes in the late afternoon.
September experiences the heaviest rainfall of the year. Ready to plan your travels but need destination ideas? Our smart tool recommends places based on the climate conditions you prefer. Start planning with our destination weather tool.


