Average monthly water temperature in Brossard, Canada
On this page you find the mean water temperature over the year in Brossard (Quebec), Canada. Dive into the water temperature trends, highlighting the best times for swimming and other activities.
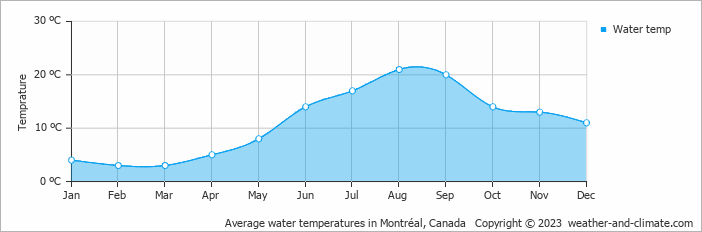
In Brossard, the water undergoes seasonal changes. The warmest month is August, with an average water temperature of 21°C (70°F).
The coldest water temperature month, February, has an average temperature of 3°C (37°F). It may not be the ideal time for a swim.
Brossard Weather by Month
Pick a month to see the average temperature, rainfall and sunshine in Brossard - and find the best time to visit.
Brossard 3-Day Forecast
Temperature Rainfall Sunshine Humidity Wind Speed Water Temp
See the full Brossard climate overview or explore weather in Canada.
Popular this month
Where to go in August - average daytime high across popular destinations.
Bucket list
Need travel inspiration? Check out our bucket list articles and be inspired.
 The 5 most beautiful lakes in Canada
Explore Canada's stunning lakes: Lake Louise, Lake Superior, Maligne Lake, Emerald Lake, and Lake Okanagan, each offering unique beauty and activities.
Canoeing the south Nahannii
The South Nahanni in the northwest of Canada is one of the most impressive wilderness rivers in the world. Canoeing the south Nahanni is something you must add to your bucket list.
See Polar Bears in Churchill Canada
Thousands of bears gather at the small town of Churchill. In the evening the northern lights give a light show against the dark evening sky. An unforgettable experience.
Banff National Park
Snowy mountains, clear blue lakes and green forests make Banff National Park a wonderful bucket list destination. The pristine wilderness is a mecca for walkers.