Average monthly snow and rainfall in Torre rinalda
The mean monthly precipitation over the year in Torre rinalda (), including rain, snow, hail.
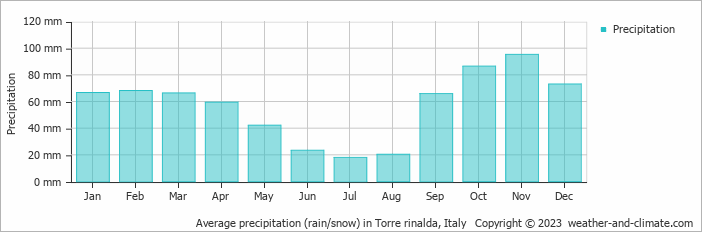
- Torre rinalda has dry periods in June, July and August.
- On average, November is the wettest month with 95 mm of precipitation.
- On average, July is the driest month with 18 mm of precipitation.
- The average amount of annual precipitation is 684 mm.
Forecast for Torre rinalda
Sat May 18
29°C | 18°C
SW  22 km/h
22 km/hbroken clouds and no rain
Sun May 19
29°C | 18°C
E 14 km/h
14 km/hbroken clouds and no rain
Mon May 20
31°C | 19°C
SE 18 km/h
18 km/hpartly cloudy and no rain


