Santa Teresa di Riva Rainfall & Precipitation: Monthly Averages and Year-Round Insights
This page shows the average amount of rainfall per month in Santa Teresa di Riva. The numbers are calculated over a 30-year period to provide a reliable average. Now, let’s break down all the details for a clearer picture.
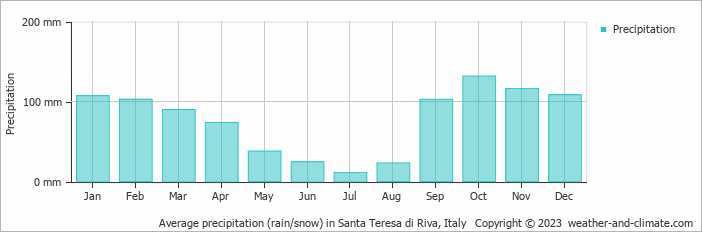
Generally, Santa Teresa di Riva receives mid-range precipitation levels, with 927 mm annually.
Monthly Precipitation Levels
The average number of days each month with precipitation (> 0.2 mm)
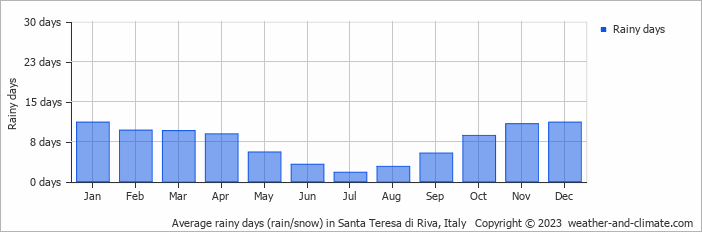
Santa Teresa di Riva can be quite wet during October, receiving approximately 132 mm of precipitation over 9 rainy days.
In contrast July, experiences much drier conditions, with 11 mm of rainfall, spread across 2 rainy days.October, the wettest month, has a maximum daytime temperature of 22°C. The city receives 189 hours of sunshine in this period. During the driest month July you can expect a temperature of 28°C. For more detailed insights into the city’s temperatures, visit our Santa Teresa di Riva Temperature page.
Annual Precipitation in Italy
The map below shows the annual precipitation across Italy. You can also select the different months in case you are interested in a specific month.
 heavy rainfall
 high
high
 moderate
 low
low
 almost none
Amsterdam Precipitation Compared World Wide
Santa Teresa di Riva’s average annual precipitation is 927 mm. Let’s compare this to some popular worldwide tourist destinations:
Boston, USA, experiences 1238 mm of annual precipitation, including significant snowfall during the winter.
Osaka, Japan, experiences 1507 mm of rainfall annually, spread across the year with wetter summers.
In Brisbane, Australia, the annual precipitation is 979 mm, making it wetter than Sydney.
Ho Chi Minh City, Vietnam, receives 1955 mm of annual rainfall, with a pronounced wet season from May to November, typical of its tropical monsoon climate.
How is Precipitation Measured?
Precipitation amounts are measured using specific gauges installed at weather stations, collecting both rain and snow and any other type of precipitation. Rainfall is measured directly in millimeters, while that from snow and ice is obtained by melting it. Automated systems often incorporate heaters to make this easier.
Information from these stations is transmitted via Wi-Fi, satellite, GPS, or telephone connections to central monitoring networks. This information is immediately updated and integrated into weather models and forecasts.
Sea vs. Land Precipitation
The proximity of a location to a large body of water can significantly affect its rainfall patterns:
- Ocean Influence: Coastal regions typically receive more rainfall due to the presence of moisture-laden winds from the ocean. These regions tend to have more humid climates and experience more frequent precipitation, especially in winter.
- Continental Climates: Areas further from the sea, such as inland or continental regions, experience less frequent rainfall and more extreme seasonal variations in precipitation.
For more detailed information about Santa Teresa di Riva’s weather, including sunshine hours, humidity levels, and temperature data, visit our Santa Teresa di Riva Climate page.
Current rainfall in Santa Teresa di Riva


