Novi Ligure Precipitation: Average Monthly Rainfall and Snowfall
This graph shows the average amount of rainfall per month in Novi Ligure (Piedmont). The numbers are calculated over a 30-year period to provide a reliable average.
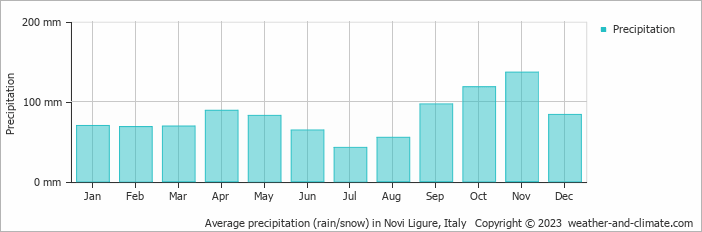
- Most rainfall (rainy season) is seen in October and November.
- On average, November is the wettest month with 137 mm of precipitation.
- On average, July is the driest month with 42 mm of precipitation.
- The average amount of annual precipitation is 975 mm.
Current rainfall in Novi Ligure
Tue Nov 12
11°C | 4°C
N  18 km/h
18 km/hpartly cloudy and no rain
Wed Nov 13
13°C | 2°C
N 7 km/h
7 km/halmost clear and no rain
Thu Nov 14
12°C | 3°C
W 11 km/h
11 km/halmost clear and no rain


