Montebello di Bertona Precipitation: Average Monthly Rainfall and Snowfall
This graph shows the average amount of rainfall per month in Montebello di Bertona (). The numbers are calculated over a 30-year period to provide a reliable average.
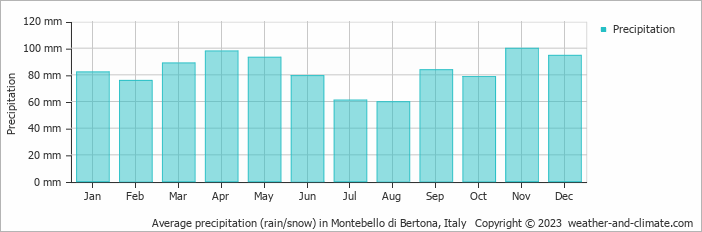
- On average, November is the wettest month with 100 mm of precipitation.
- On average, August is the driest month with 60 mm of precipitation.
- The average amount of annual precipitation is 994 mm.
Current rainfall in Montebello di Bertona
Sat Nov 23
8°C | 0°C
W  4 km/h
4 km/hclear and no rain
Sun Nov 24
11°C | 3°C
W 4 km/h
4 km/hclear and no rain
Mon Nov 25
12°C | 4°C
E 7 km/h
7 km/hpartly cloudy and no rain


