Miasino Precipitation: Average Monthly Rainfall and Snowfall
This graph shows the average amount of rainfall per month in Miasino (). The numbers are calculated over a 30-year period to provide a reliable average.
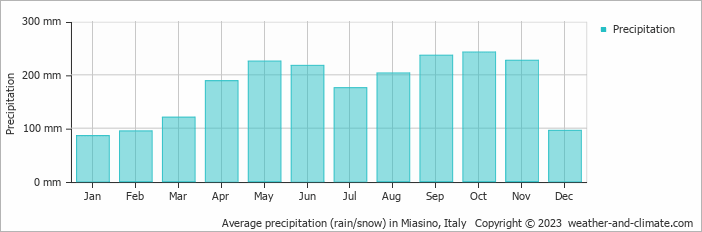
- A lot of rain (rainy season) falls in the months: March, April, May, June, July, August, September, October and November.
- On average, October is the wettest month with 243 mm of precipitation.
- On average, January is the driest month with 86 mm of precipitation.
- The average amount of annual precipitation is 2113 mm.
Current rainfall in Miasino
Tue Dec 03
10°C | 1°C
SE  4 km/h
4 km/halmost clear and no rain
Wed Dec 04
10°C | 0°C
NW 7 km/h
7 km/hclear and no rain
Thu Dec 05
9°C | -2°C
NW 11 km/h
11 km/hpartly cloudy and no rain


