Margherita di Savoia Precipitation: Average Monthly Rainfall and Snowfall
This graph shows the average amount of rainfall per month in Margherita di Savoia (Puglia (Apulia)). The numbers are calculated over a 30-year period to provide a reliable average.
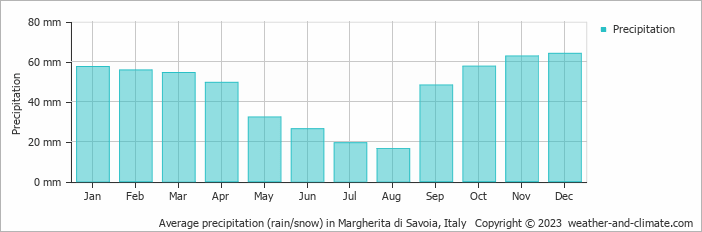
- Margherita di Savoia has dry periods in July and August.
- On average, December is the wettest month with 64 mm of precipitation.
- On average, August is the driest month with 16 mm of precipitation.
- The average amount of annual precipitation is 544 mm.
Current rainfall in Margherita di Savoia
Sat Nov 23
12°C | 6°C
W  22 km/h
22 km/halmost clear and no rain
Sun Nov 24
13°C | 6°C
SW 7 km/h
7 km/halmost clear and no rain
Mon Nov 25
13°C | 5°C
W 11 km/h
11 km/hclear and no rain


