Manang Monthly Rainfall & Precipitation
This page shows both the average monthly rainfall and the number of rainy days in Manang, Nepal. The numbers reflect climate data gathered over a 30-year period, from 1990 to 2020. Let's explore the details to provide you with a complete overview.
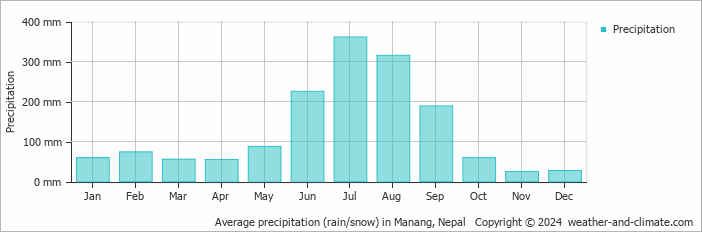
Manang experiences significant rain/snowfall throughout the year, averaging 1530 mm (60 in) of precipitation annually. However, this abundant rainfall is not evenly distributed, with a distinct dry and rainy season during certain months. You can clearly see this in our monthly precipitation graphs below.
Monthly Rainfall & Rainy Days
Monthly Precipitation Levels
The average number of days each month with precipitation (> 0.2 mm (0.01 in))

Significant seasonal changes in precipitation occur throughout the year. During the wettest month, July receives substantial rainfall, averaging 361 mm (14 in) of precipitation, recorded across 22 rainy days.
In contrast, the driest month, November brings less snowfall, with 25 mm (1 in) over 3 snowy days.
July, the wettest month, has a maximum daytime temperature of 11°C (52°F). The city receives 105 hours of sunshine in this period. During the driest month November you can expect a temperature of 1°C (34°F). For more detailed insights into the city's temperatures, visit our Manang Temperature page.
Explore Manang's Historical Precipitation: 1977-2026
Browse day-by-day precipitation records for Manang spanning 50 years. Select any month and year to see actual rainfall and snowfall recorded on each day.
Annual Rainfall in Nepal: City Comparison
The map below shows the annual precipitation across Nepal. You can also select the different months in case you are interested in a specific month.
Manang vs World: Rainfall Compared
Manang's average annual precipitation is 1530 mm (60 in). Let's compare this to some popular worldwide tourist destinations:
Seville, Spain, experiences 541 mm (21 in) of rainfall annually, with wet winters and dry summers typical of southern Spain.
In Shanghai, China, the annual average precipitation is 1347 mm (53 in), with a humid subtropical climate.
Perth, Australia, receives 565 mm (22 in) of rainfall annually, mostly during the winter months.
Mumbai, India, experiences a tropical monsoon climate with 1860 mm (73 in) of annual rainfall, with the majority of precipitation happening during the monsoon season from June to September.
Precipitation amounts are measured using specific gauges installed at weather stations, collecting both rain and snow and any other type of precipitation. Rainfall is measured directly in millimeters, while that from snow and ice is obtained by melting it. Automated systems often incorporate heaters to make this easier.
Information from these stations is transmitted via Wi-Fi, satellite, GPS, or telephone connections to central monitoring networks. This information is immediately updated and integrated into weather models and forecasts.
- Mawsynram in India is noted as being the wettest place on earth, with over 11 meters (36 feet) of rain falling every year.
- In contrast, Antofagasta in Chile is among the driest places on the planet, getting less than 0.1mm (0.004 inches) per year, with some years recording virtually no rainfall.
- Nearly 1,650 thunderstorm cells are estimated over the planet at any given time.
For more detailed information about Manang's weather, including sunshine hours, humidity levels, and temperature data, visit our Manang Climate page.
Manang Weather by Month
Pick a month to see the average temperature, rainfall and sunshine in Manang - and find the best time to visit.
Manang 3-Day Forecast
Temperature Rainfall Sunshine
See the full Manang climate overview or explore weather in Nepal.
Popular this month
Where to go in August - average daytime high across popular destinations.
Bucket list
Need travel inspiration? Check out our bucket list articles and be inspired.
 10 Hidden gems in Asia you need to visit
Explore 10 hidden gems in Asia offering authentic experiences, from pristine beaches and remote islands to cultural treks and peaceful mountain villages.
 A pilgrimage through Nepal: from the Himalayas to the Heart
Go on a spiritual journey through Nepal, discovering its rich heritage, breathtaking Himalayas, sacred monasteries, and vibrant culture.
Jaljale Himal: Nepal’s Untouched Trekking Paradise
Explore Jaljale Himal in eastern Nepal, offering remote trekking, stunning peaks, and rich culture. Best time: October-December and February-March.