Lukla Monthly Rainfall & Precipitation
This page shows both the average monthly rainfall and the number of rainy days in Lukla, Nepal. The figures are based on a 30-year period (1990–2020) to provide a reliable average. Let's now guide you through the details for a complete overview.
Lukla has a relatively rain/snowy climate with high precipitation levels, averaging 2109 mm (83 in) of rain/snowfall annually. Despite the high annual total, it does experience a distinct dry and rainy season during certain months. Examine our detailed charts below to understand these seasonal patterns.
Monthly Rainfall & Rainy Days
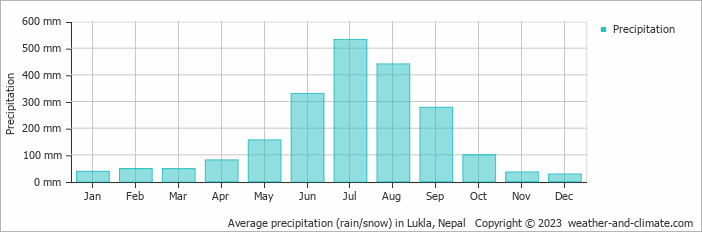
Monthly Precipitation Levels
The average number of days each month with precipitation (> 0.2 mm (0.01 in))
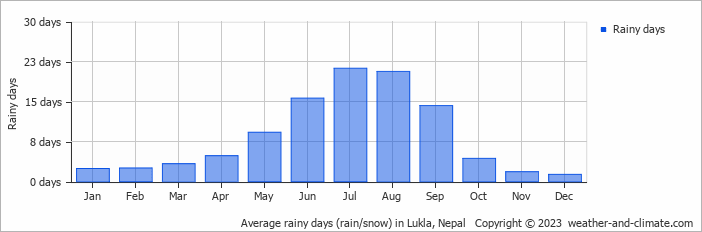
Significant seasonal changes in precipitation occur throughout the year. During the wettest month, July receives substantial rainfall, averaging 532 mm (21 in) of precipitation, recorded across 21 rainy days.
In contrast, the driest month, December brings less snowfall, with 27 mm (1.1 in) over a single snowy day.
July, the wettest month, has a maximum daytime temperature of 14°C (57°F). During the driest month December you can expect a temperature of 4°C (39°F). For more detailed insights into the city's temperatures, visit our Lukla Temperature page.
Explore Lukla's Historical Precipitation: 1976-2026
Browse day-by-day precipitation records for Lukla spanning 51 years. Select any month and year to see actual rainfall and snowfall recorded on each day.
Annual Rainfall in Nepal: City Comparison
The map below shows the annual precipitation across Nepal. You can also select the different months in case you are interested in a specific month.
Lukla vs World: Rainfall Compared
Lukla's average annual precipitation is 2109 mm (83 in). Let's compare this to some popular worldwide tourist destinations:
The climate in San Francisco, USA, is influenced by coastal weather, with 469 mm (18 in) of rainfall mostly during the winter months.
Osaka, Japan, experiences 1507 mm (59 in) of rainfall annually, spread across the year with wetter summers.
Melbourne, Australia, has 690 mm (27 in) of rainfall annually, spread fairly evenly throughout the year.
Singapore, situated near the equator, gets 2581 mm (102 in) of rainfall annually, with no distinct dry season and consistent monthly precipitation.
Precipitation amounts are measured using specific gauges installed at weather stations, collecting both rain and snow and any other type of precipitation. Rainfall is measured directly in millimeters, while that from snow and ice is obtained by melting it. Automated systems often incorporate heaters to make this easier.
Information from these stations is transmitted via Wi-Fi, satellite, GPS, or telephone connections to central monitoring networks. This information is immediately updated and integrated into weather models and forecasts.
Precipitation has a very strong role in determining the local climate and ecosystem:
- Changing Rainfall Patterns: Global warming causes drastic changes in the patterns of rainfall. Some areas have been experiencing increased frequency and intensity of rainfall, while other areas experience longer dry spells or even droughts.
- Local Impacts: Many regions are experiencing heavier rainfall in the winter months and drier, hotter summers. This affects agriculture, water resources, and ecosystems.
- "Ginger" was the longest-lasting Atlantic tropical storm, which spun around the open ocean for 28 days in 1971.
- The world's largest snowflake was recorded in the Guinness Book of Records, at 38 cm (15 inches) wide and 20 cm (7.9 inches) thick. The snowflake fell at Fort Keogh, Montana, USA, on 28 January 1887.
- The greatest snowfall recorded was on Mt. Rainier, Washington State, USA, over 31.5 meters (103 feet) fell during the winter of 1972.
For more detailed information about Lukla's weather, including sunshine hours, humidity levels, and temperature data, visit our Lukla Climate page.
Lukla Weather by Month
Pick a month to see the average temperature, rainfall and sunshine in Lukla - and find the best time to visit.
Lukla 3-Day Forecast
Temperature Rainfall
See the full Lukla climate overview or explore weather in Nepal.
Popular this month
Where to go in August - average daytime high across popular destinations.
Bucket list
Need travel inspiration? Check out our bucket list articles and be inspired.
 10 Hidden gems in Asia you need to visit
Explore 10 hidden gems in Asia offering authentic experiences, from pristine beaches and remote islands to cultural treks and peaceful mountain villages.
 A pilgrimage through Nepal: from the Himalayas to the Heart
Go on a spiritual journey through Nepal, discovering its rich heritage, breathtaking Himalayas, sacred monasteries, and vibrant culture.
Jaljale Himal: Nepal’s Untouched Trekking Paradise
Explore Jaljale Himal in eastern Nepal, offering remote trekking, stunning peaks, and rich culture. Best time: October-December and February-March.