



















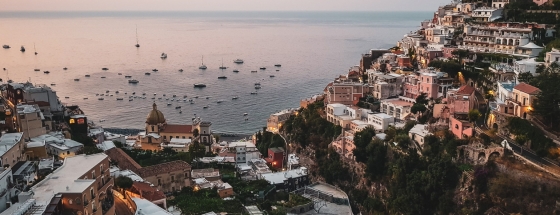
 The 10 most beautiful historical towns in Italy
Discover Italy's top 10 historic towns, featuring breathtaking medieval architecture and deep-rooted history, ideal for enthusiasts of extraordinary cities.
This page shows both the average monthly rainfall and the number of rainy days in Loreo, Veneto, Italy. The numbers reflect climate data gathered over a 30-year period, from 1990 to 2020. Now, let's break down all the details for a clearer picture.
Generally, Loreo experiences moderate precipitation patterns, averaging 921 mm (36 in) yearly.
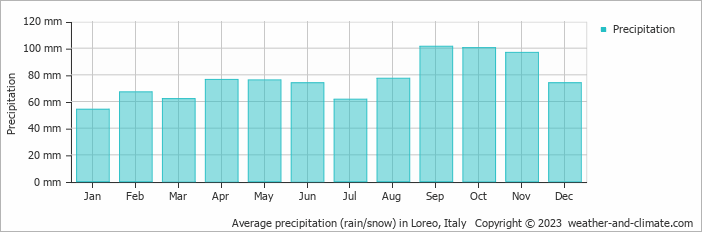
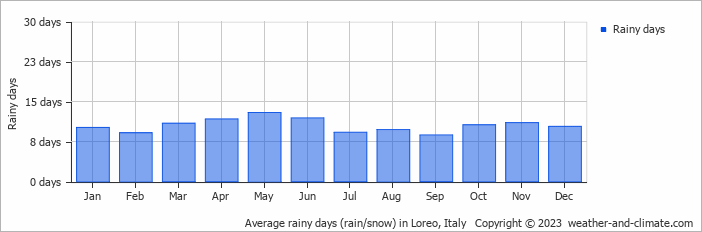
Loreo offers a pleasant mix of wetter and slightly drier months. The difference in precipitation between September (101 mm (4 in)) and January (54 mm (2.1 in)) is not too significant, making the climate enjoyable for visitors and residents alike.
September, the wettest month, has a maximum daytime temperature of 25°C (77°F). The city receives 184 hours of sunshine in this period. During the driest month January you can expect a temperature of 9°C (48°F). For more detailed insights into the city's temperatures, visit our Loreo Temperature page.
The map below shows the annual precipitation across Italy. You can also select the different months in case you are interested in a specific month.
Loreo's average annual precipitation is 921 mm (36 in). Let's compare this to some popular worldwide tourist destinations:
In Barcelona, Spain, the average annual precipitation is 620 mm (24 in), evenly distributed across the year with no extreme wet or dry seasons.
Beijing, China, receives 560 mm (22 in) of annual precipitation, concentrated in the summer months.
In Tokyo, Japan, the average annual precipitation is 1528 mm (60 in), with significant summer rains due to typhoon season.
Kuala Lumpur, Malaysia, receives 2529 mm (100 in) of annual rainfall, characteristic of its equatorial tropical rainforest climate, with consistent rainfall throughout the year and peak months during March and November.
Precipitation amounts are measured using specific gauges installed at weather stations, collecting both rain and snow and any other type of precipitation. Rainfall is measured directly in millimeters, while that from snow and ice is obtained by melting it. Automated systems often incorporate heaters to make this easier.
Information from these stations is transmitted via Wi-Fi, satellite, GPS, or telephone connections to central monitoring networks. This information is immediately updated and integrated into weather models and forecasts.
For more detailed information about Loreo's weather, including sunshine hours, humidity levels, and temperature data, visit our Loreo Climate page.
Pick a month to see the average temperature, rainfall and sunshine in Loreo - and find the best time to visit.
Temperature Rainfall Sunshine Humidity
See the full Loreo climate overview or explore weather in Italy.
Where to go in September - average daytime high across popular destinations.
Need travel inspiration? Check out our bucket list articles and be inspired.
The 10 most beautiful historical towns in Italy
Discover Italy's top 10 historic towns, featuring breathtaking medieval architecture and deep-rooted history, ideal for enthusiasts of extraordinary cities.
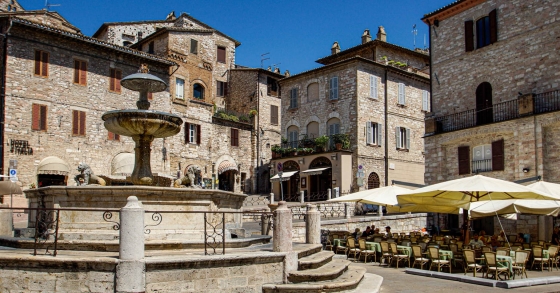 Experience mystical Assisi
Assisi is the most famous town in Umbria and best known because of Saints Francis and Clare of Assisi. Many visitors come to see the breathtaking San Francesco basilica.
 The Battle of Oranges
This is one of the most unusual festivals in Italy. The festival is held in the middle of winter during the winter carnival. The entire city of Ivrea near Turin turns into a battlefield.
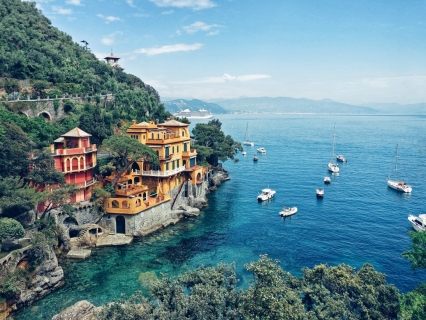 The most beautiful fishing village of Italy
Portofino is the most beautiful fishing village in Italy and maybe even in the world. We absolutely recommend that you add this beautiful place to your bucket list.