Linhult Precipitation: Average Monthly Rainfall and Snowfall
This graph shows the average amount of rainfall per month in Linhult (). The numbers are calculated over a 30-year period to provide a reliable average.
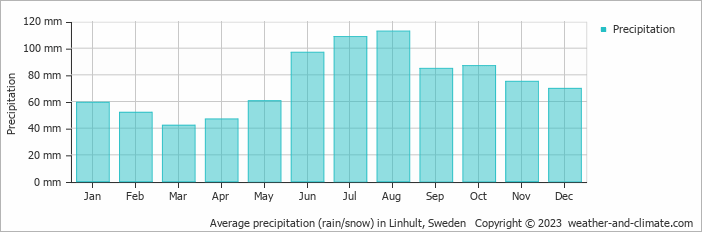
- Most rainfall (rainy season) is seen in July and August.
- On average, August is the wettest month with 113 mm of precipitation.
- On average, March is the driest month with 42 mm of precipitation.
- The average amount of annual precipitation is 895 mm.
Current rainfall in Linhult
Thu Dec 12
-2°C | -9°C
NW  7 km/h
7 km/hpartly cloudy and no rain
Fri Dec 13
4°C | -4°C
SW 22 km/h
22 km/h0.7 mm
overcast and small chance of slight sleet
Sat Dec 14
3°C | -2°C
SW 25 km/h
25 km/h2.8 mm
broken clouds and sleet