Hadsund Monthly Rainfall & Precipitation
This page shows both the average monthly rainfall and the number of rainy days in Hadsund, Nordjylland, Denmark. The figures are based on a 30-year period (1990–2020) to provide a reliable average. Let's explore the details to provide you with a complete overview.
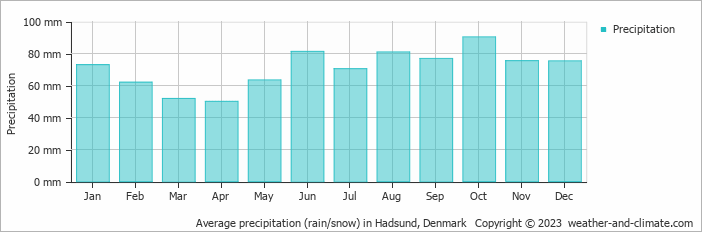
Generally, Hadsund receives mid-range precipitation levels, with 850 mm (33 in) annually.
Monthly Precipitation Levels
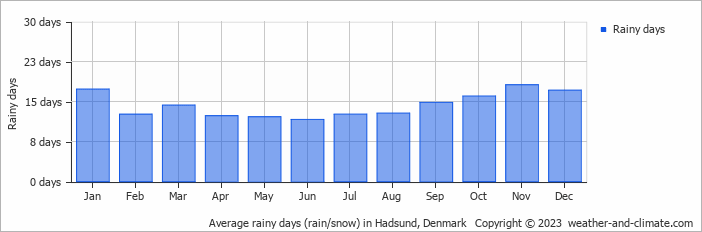
The average number of days each month with precipitation (> 0.2 mm (0.01 in))
Hadsund experiences moderate seasonal variation in rainfall, with monthly averages ranging from 90 mm (3.5 in) in October, the wettest month, and 50 mm (2 in) in April, the driest month.
October, the wettest month, has a maximum daytime temperature of 13°C (55°F). The city receives 102 hours of sunshine in this period. During the driest month April you can expect a temperature of 10°C (50°F). For more detailed insights into the city's temperatures, visit our Hadsund Temperature page.
Daily Historical Precipitation
50-year average (1976-2025)
Average daily rainfall for each day of the month based on long-term records.
Average precipitation in June
Explore Hadsund's Historical Precipitation: 1976-2026
Browse day-by-day precipitation records for Hadsund spanning 51 years. Select any month and year to see actual rainfall and snowfall recorded on each day.
Annual Rainfall in Denmark: City Comparison
The map below shows the annual precipitation across Denmark. You can also select the different months in case you are interested in a specific month.
 heavy rainfall
 high
high
 moderate
 low
low
 almost none
Hadsund vs World: Rainfall Compared
Hadsund's average annual precipitation is 850 mm (33 in). Let's compare this to some popular worldwide tourist destinations:
Athens, Greece, receives an average annual precipitation of 400 mm (16 in), making it one of the drier Mediterranean climates with rainfall mostly in winter.
Beijing, China, receives 560 mm (22 in) of annual precipitation, concentrated in the summer months.
In Tokyo, Japan, the average annual precipitation is 1528 mm (60 in), with significant summer rains due to typhoon season.
Bangkok, Thailand, experiences a tropical monsoon climate with 1668 mm (66 in) of annual rainfall, with the heaviest precipitation occurring during September and October.
Precipitation amounts are measured using specific gauges installed at weather stations, collecting both rain and snow and any other type of precipitation. Rainfall is measured directly in millimeters, while that from snow and ice is obtained by melting it. Automated systems often incorporate heaters to make this easier.
Information from these stations is transmitted via Wi-Fi, satellite, GPS, or telephone connections to central monitoring networks. This information is immediately updated and integrated into weather models and forecasts.
- "Ginger" was the longest-lasting Atlantic tropical storm, which spun around the open ocean for 28 days in 1971.
- The world's largest snowflake was recorded in the Guinness Book of Records, at 38 cm (15 inches) wide and 20 cm (7.9 inches) thick. The snowflake fell at Fort Keogh, Montana, USA, on 28 January 1887.
- The greatest snowfall recorded was on Mt. Rainier, Washington State, USA—over 31.5 meters (103 feet) fell during the winter of 1972.
For more detailed information about Hadsund's weather, including sunshine hours, humidity levels, and temperature data, visit our Hadsund Climate page.


