
















 Iceland Airwaves Festival
On its way to its 20th edition in 2019 Iceland Airwaves is a festival you need to visit once in your life. Everything from lagoons and bookstores to bars and concert halls is filled with music.
This page shows both the average monthly rainfall and the number of rainy days in Garðabær, Capital Region, Iceland. The numbers reflect climate data gathered over a 30-year period, from 1990 to 2020. Let's now guide you through the details for a complete overview.
Garðabær experiences significant rain/snowfall throughout the year, averaging 1450 mm (57 in) of precipitation annually.
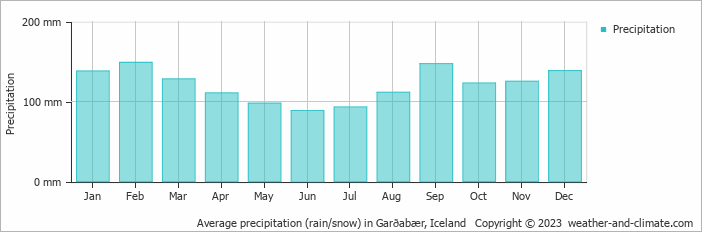
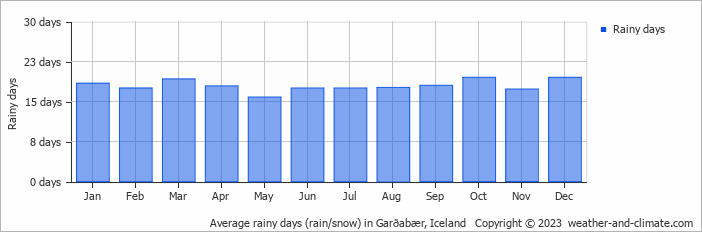
The amount of precipitation varies moderately throughout the year. The wettest month, February, sees around 149 mm (5.9 in) of snow/rainfall, perfect for those who enjoy a bit of snow/rain now and then. The driest month, June, still receives a respectable 89 mm (3.5 in) of rainfall.
February, the wettest month, has a maximum daytime temperature of 4°C (39°F). The city receives 60 hours of sunshine in this period. During the driest month June you can expect a temperature of 14°C (57°F). For more detailed insights into the city's temperatures, visit our Garðabær Temperature page.
Average daily rainfall for each day of the month based on long-term records. 50-year average (1976-2025)
Browse day-by-day precipitation records for Garðabær spanning 51 years. Select any month and year to see actual rainfall and snowfall recorded on each day.
The map below shows the annual precipitation across Iceland. You can also select the different months in case you are interested in a specific month.
Garðabær's average annual precipitation is 1450 mm (57 in). Let's compare this to some popular worldwide tourist destinations:
The climate in San Francisco, USA, is influenced by coastal weather, with 469 mm (18 in) of rainfall mostly during the winter months.
In Seoul, South Korea, the average annual precipitation is 1237 mm (49 in), with most rain falling during the summer monsoon season.
In Brisbane, Australia, the annual precipitation is 979 mm (39 in), making it wetter than Sydney.
Bangkok, Thailand, experiences a tropical monsoon climate with 1668 mm (66 in) of annual rainfall, with the heaviest precipitation occurring during September and October.
Precipitation amounts are measured using specific gauges installed at weather stations, collecting both rain and snow and any other type of precipitation. Rainfall is measured directly in millimeters, while that from snow and ice is obtained by melting it. Automated systems often incorporate heaters to make this easier.
Information from these stations is transmitted via Wi-Fi, satellite, GPS, or telephone connections to central monitoring networks. This information is immediately updated and integrated into weather models and forecasts.
Tropical Rainforests: In tropical regions, rainfall is generally abundant year-round. Areas near the equator, like the Amazon rainforest, can receive up to 3000 mm (118 in) of rain annually.
Desert Regions: Deserts such as the Sahara and Arabian deserts typically see less than 250 mm (9.8 in) of rainfall annually. Rainfall tends to be infrequent, but when it does occur, it is often intense.
Temperate Zones: In temperate regions, precipitation tends to be more evenly distributed, though areas closer to the ocean may see more rain in the winter months, and areas further inland experience drier summers.
Polar Regions: Precipitation in polar regions, like Antarctica, is extremely low, often falling as snow. Average annual precipitation in Antarctica is less than 200 mm (7.9 in), with some areas receiving as little as 50 mm (2 in) annually.
For more detailed information about Garðabær's weather, including sunshine hours, humidity levels, and temperature data, visit our Garðabær Climate page.
Pick a month to see the average temperature, rainfall and sunshine in Garðabær - and find the best time to visit.
Temperature Rainfall Sunshine Humidity Wind Speed Water Temp
See the full Garðabær climate overview or explore weather in Iceland.
Where to go in September - average daytime high across popular destinations.
Reykjavík 12°C (54°F) Kópavogur12°C (54°F) Hella
 13°C (55°F) Selfoss12°C (54°F) Keflavík12°C (54°F) Höfn10°C (50°F) Egilsstadir
 10°C (50°F) Akureyri9°C (48°F)
 Need travel inspiration? Check out our bucket list articles and be inspired.
Iceland Airwaves Festival
On its way to its 20th edition in 2019 Iceland Airwaves is a festival you need to visit once in your life. Everything from lagoons and bookstores to bars and concert halls is filled with music.
 Where to stay in Iceland: Nordic idyll that feels like home
If you are travelling to Iceland for the first time, the Golden Circle will probably make it onto your bucket list. Geysir Hestar is located right in between two spectacular sights of the Golden Circle.
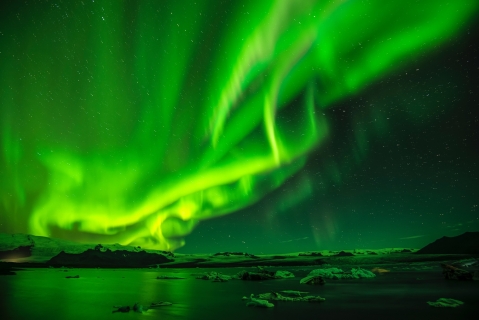
 See the northern lights
The northern lights, polar light or Aarora Borealis is a true spectacle of nature! Green, sometimes purple, red and yellow streaks of light colors the dark skies.

 The 10 most charming villages in France
Discover France's top 10 beautiful villages. From Normandy to the Côte d'Azur, experience quaint squares and cobbled streets. Which one will you visit this summer?