Kópavogur Weather & Climate: Best Time to Visit
Average temperatures, rainfall, sunshine and the best time to visit Kópavogur.
Climate overview of Kópavogur
Temperatures in Kópavogur, Capital Region, Iceland, vary greatly throughout the year. July is the hottest month at 16°C (61°F), while January is the coldest at 3°C (37°F).
With around 1445 mm (57 in) of annual rain/snowfall, Kópavogur has a notably wet climate. However, this rain/snowfall is not evenly distributed — the city has mild summers and cold winters. The wettest month is February. Sunshine peaks in May, when the city sees around 6.7 hours of sunshine per day.
Kópavogur Weather by Month
Pick a month to see the average temperature, rainfall and sunshine in Kópavogur - and find the best time to visit.
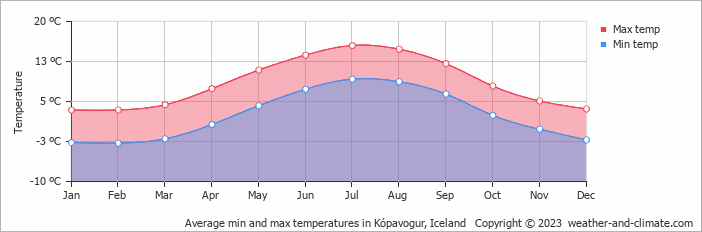
Monthly Temperature in Kópavogur
The climate in Kópavogur is known for significant temperature differences throughout the year, making the weather dynamic. Average daytime temperatures reach a moderate 16°C (61°F) in July. In January, the coolest month of the year, temperatures drop to a chilly 3°C (37°F).
At night, temperatures range from around 9°C (48°F) in July to -3°C (27°F) in January.
Check out our detailed temperature page for more information.
Temperature ranges by month
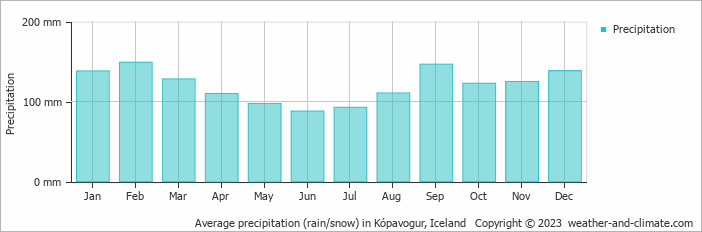
Rainfall in Kópavogur
Kópavogur has a notably wet climate with abundant precipitation, recording 1445 mm (57 in) of rain/snowfall per year. Kópavogur experiences moderate seasonal variation in snow/rainfall, with monthly averages ranging from 149 mm (5.9 in) in February, the wettest month, and 88 mm (3.5 in) in June, the driest month. For more details, please visit our Kópavogur Precipitation page.
The mean monthly precipitation over the year, including rain, hail, and snow
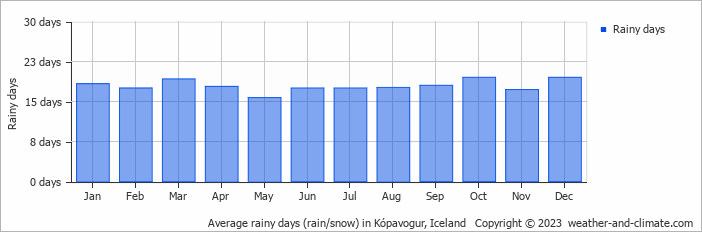
The average number of days each month with precipitation
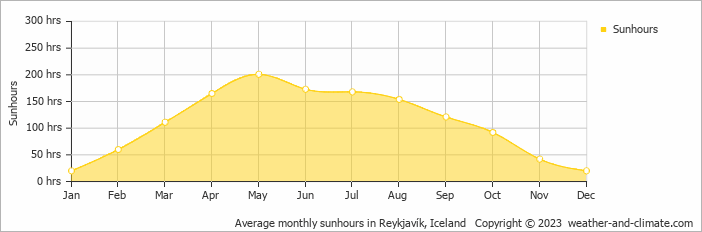
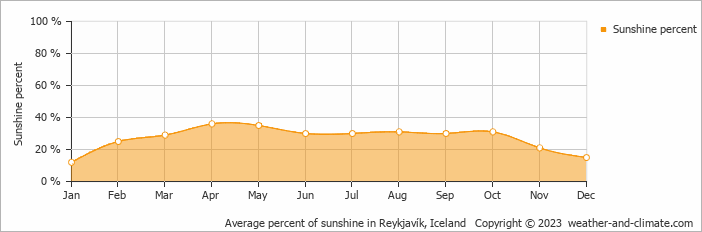
Sunshine Hours in Kópavogur
Kópavogur can be enjoyed more throughout the sunniest month of May under a blue sky, with approximately 6.7 hours of sunshine daily. In contrast, the city experiences much darker days in January, with only 0.7 hours of sunlight per day.
Visit our detailed sunshine hours page for more information.
Monthly hours of sunshine
Daily hours of sunshine
Daily percentage of sunshine
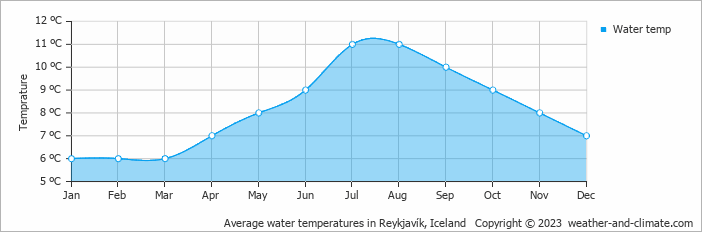
Water Temperature in Kópavogur
The mean water temperature over the year ranges from 6°C (43°F) in January to 11°C (52°F) in July.
Water temperature over the year
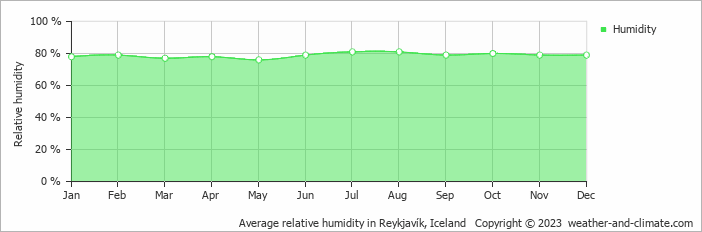
Humidity in Kópavogur by Month
The relative humidity is high throughout the year in Kópavogur.
The city experiences its highest humidity in July, reaching 81%. In May, the humidity drops to its lowest level at 76%. What does this mean? Read our detailed page on humidity levels for further details.
Relative humidity over the year
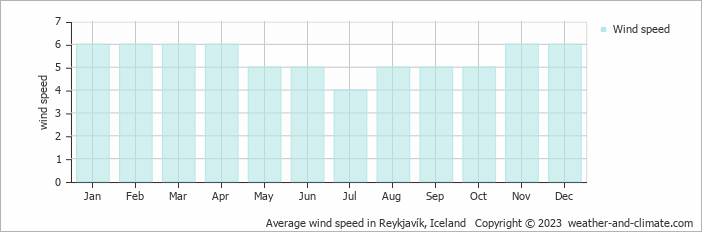
Wind Speed in Kópavogur
The mean wind speed varies between 4 m/s (8 knots) and 6 m/s (12 knots) throughout the year. It is lowest in July and highest during January, February, March, April, November and December. What does this mean?
The mean monthly wind speed over the year (meters per second)
Best Time to Visit Kópavogur
Monthly ratings reflect general weather comfort, based on daytime temperature and rainfall. Swimming and winter conditions are highlighted separately where relevant.
- Best overall: June and July
- Warmest weather: July and August
- Most sunshine: May
- Seasonal pattern: Mild summers and cold winters
- Coldest conditions: January, with freezing nights around -3°C (27°F).
Frequently asked questions about the climate in Kópavogur
What is the best time to visit Kópavogur?
June and July typically offer the most optimal weather in Kópavogur. In contrast, January, February, March, April, September, October, November and December tend to have less optimal conditions. Kópavogur has mild summers and cold winters.
What temperatures can I expect in Kópavogur?
Daytime highs range from 3°C (37°F) in January to 16°C (61°F) in July. Nighttime lows range from -3°C (27°F) to 9°C (48°F). Temperatures vary considerably through the year.
How much rain does Kópavogur get?
Annual rainfall is around 1445 mm (57 in). February is the wettest month with 149 mm (5.9 in), while June is the driest with 88 mm (3.5 in). In the coldest months, precipitation may fall as snow/rain.
How sunny is Kópavogur?
Kópavogur receives around 1,327 hours of sunshine per year. May is the sunniest month with 201 hours, while January is the cloudiest with just 20 hours.
Kópavogur 3-Day Forecast
Kópavogur 3-Day Forecast
Kópavogur on the map
Kópavogur is highlighted - select any city to see its climate.
Popular this month
Where to go in July - average daytime high across popular destinations.
Bucket list
Need travel inspiration? Check out our bucket list articles and be inspired.
 Iceland Airwaves Festival
On its way to its 20th edition in 2019 Iceland Airwaves is a festival you need to visit once in your life. Everything from lagoons and bookstores to bars and concert halls is filled with music.
Where to stay in Iceland: Nordic idyll that feels like home
If you are travelling to Iceland for the first time, the Golden Circle will probably make it onto your bucket list. Geysir Hestar is located right in between two spectacular sights of the Golden Circle.
 See the northern lights
The northern lights, polar light or Aarora Borealis is a true spectacle of nature! Green, sometimes purple, red and yellow streaks of light colors the dark skies.