
















 Iceland Airwaves Festival
On its way to its 20th edition in 2019 Iceland Airwaves is a festival you need to visit once in your life. Everything from lagoons and bookstores to bars and concert halls is filled with music.
Sunshine plays a big role in understanding the climate of a city. This page shows the total number of hours of direct sunlight per month and the average hours per day in Garðabær, Capital Region, Iceland. This average is based on long-term data collected between 1990 and 2020.
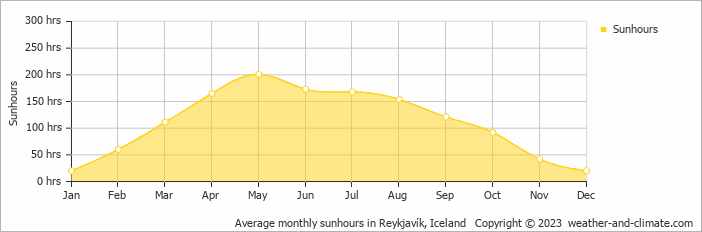
Seasonal sunshine in Garðabær varies. It peaks at 201 hours in May and drops to 20 hours in January. The total annual amount of sun is 1327 hours.
For those who appreciate different seasons, Garðabær serves as an ideal destination. Expect longer, more sun-filled days in May with an average of 6.7 hours of sunshine daily, and embrace the darker days in January, offering only 0.7 hours of daily sunlight.
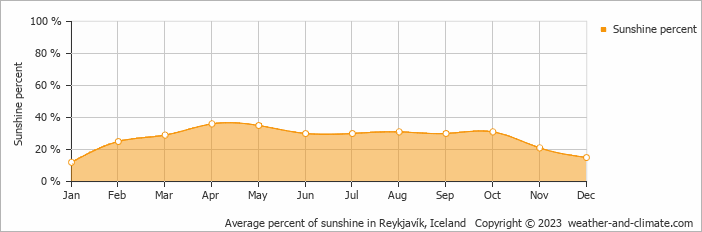
On average the sun shines 36% of the time during the day in April, the highest percentage of any month. January has the lowest percentage at 12%.
Garðabær enjoys an average of 1327 hours of sunshine annually. Let’s compare this with some popular tourist destinations:
Athens, Greece, enjoys 2769 hours of sunshine each year, making it one of the sunniest destinations in the Mediterranean region.
In contrast, Juneau, Alaska, receives only about 1523 hours of sunshine per year and is known for its very short days in winter and frequently overcast conditions.
Toronto, Canada, sees around 2071 hours of sunshine each year, with especially long, bright summer days.
Melbourne, Australia, has 2380 hours of sunshine annually, with its famous “four seasons in a day” weather pattern.
February, Garðabær’s wettest month, receives 93 mm (3.7 in) of snow/rainfall and has a maximum daytime temperature of 4°C (39°F). During the driest month June you can expect a temperature of 14°C (57°F).
For more detailed insights into the city’s temperatures, check out our Temperature page. To explore more about precipitation patterns, visit our Garðabær Precipitation page.
Pick a month to see the average temperature, rainfall and sunshine in Garðabær - and find the best time to visit.
Temperature Rainfall Sunshine Humidity Wind Speed Water Temp
See the full Garðabær climate overview or explore weather in Iceland.
Where to go in September - average daytime high across popular destinations.
Reykjavík 12°C (54°F) Kópavogur12°C (54°F) Hella
 13°C (55°F) Selfoss12°C (54°F) Keflavík12°C (54°F) Höfn10°C (50°F) Egilsstadir
 10°C (50°F) Akureyri9°C (48°F)
 Need travel inspiration? Check out our bucket list articles and be inspired.
Iceland Airwaves Festival
On its way to its 20th edition in 2019 Iceland Airwaves is a festival you need to visit once in your life. Everything from lagoons and bookstores to bars and concert halls is filled with music.
 Where to stay in Iceland: Nordic idyll that feels like home
If you are travelling to Iceland for the first time, the Golden Circle will probably make it onto your bucket list. Geysir Hestar is located right in between two spectacular sights of the Golden Circle.
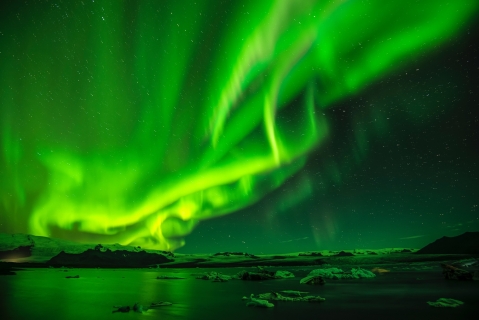
 See the northern lights
The northern lights, polar light or Aarora Borealis is a true spectacle of nature! Green, sometimes purple, red and yellow streaks of light colors the dark skies.

 The 10 most charming villages in France
Discover France's top 10 beautiful villages. From Normandy to the Côte d'Azur, experience quaint squares and cobbled streets. Which one will you visit this summer?