Bozcaada Monthly Rainfall & Precipitation
This page shows both the average monthly rainfall and the number of rainy days in Bozcaada, Aegean Region, Turkey. These averages rely on historical data collected over 30 years, from 1990 to 2020. Let's now guide you through the details for a complete overview.
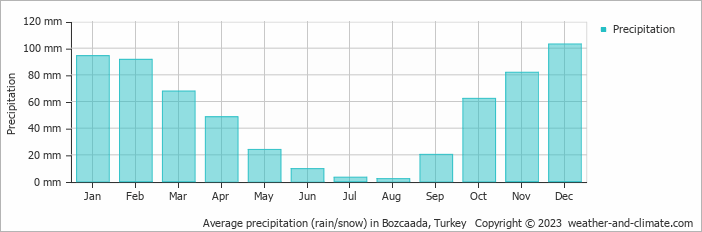
Generally, Bozcaada has a moderate amount of precipitation, averaging 608 mm (24 in) of rainfall annually. However, it does experience a distinct dry season during certain months. Take a look at our detailed charts below to see the seasonal variation.
Monthly Rainfall & Rainy Days
Monthly Precipitation Levels
The average number of days each month with precipitation (> 0.2 mm (0.01 in))
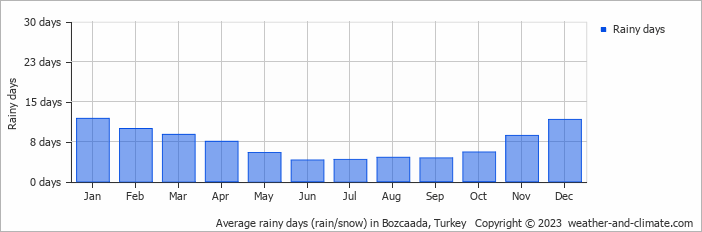
The climate in Bozcaada shows significant variation throughout the year. Expect 103 mm (4.1 in) of precipitation during the wettest month December, distributed over 12 rainy days.
In contrast, August offers drier and sunnier days, with around 2 mm (0.1 in) of rainfall over 5 rainy days.
December, the wettest month, has a maximum daytime temperature of 14°C (57°F). The city receives 88 hours of sunshine in this period. During the driest month August you can expect a temperature of 29°C (84°F). For more detailed insights into the city's temperatures, visit our Bozcaada Temperature page.
Daily Historical Precipitation
Average daily rainfall for each day of the month based on long-term records. 50-year average (1976-2025)
Average precipitation in August
Explore Bozcaada's Historical Precipitation: 1976-2026
Browse day-by-day precipitation records for Bozcaada spanning 51 years. Select any month and year to see actual rainfall and snowfall recorded on each day.
Annual Rainfall in Turkey: City Comparison
The map below shows the annual precipitation across Turkey. You can also select the different months in case you are interested in a specific month.
Bozcaada vs World: Rainfall Compared
Bozcaada's average annual precipitation is 608 mm (24 in). Let's compare this to some popular worldwide tourist destinations:
New York City, USA, receives 1276 mm (50 in) of rainfall annually, with precipitation evenly distributed throughout the year.
Osaka, Japan, experiences 1507 mm (59 in) of rainfall annually, spread across the year with wetter summers.
Melbourne, Australia, has 690 mm (27 in) of rainfall annually, spread fairly evenly throughout the year.
Ho Chi Minh City, Vietnam, receives 1955 mm (77 in) of annual rainfall, with a pronounced wet season from May to November, typical of its tropical monsoon climate.
Precipitation amounts are measured using specific gauges installed at weather stations, collecting both rain and snow and any other type of precipitation. Rainfall is measured directly in millimeters, while that from snow and ice is obtained by melting it. Automated systems often incorporate heaters to make this easier.
Information from these stations is transmitted via Wi-Fi, satellite, GPS, or telephone connections to central monitoring networks. This information is immediately updated and integrated into weather models and forecasts.
Climate change is affecting precipitation patterns worldwide, including Bozcaada:
- Changing Rainfall Patterns: Global warming causes drastic changes in the patterns of rainfall. Some areas have been experiencing increased frequency and intensity of rainfall, while other areas experience longer dry spells or even droughts.
- Local Impacts: Many regions are experiencing heavier rainfall in the winter months and drier, hotter summers. This affects agriculture, water resources, and ecosystems.
- The U.S. has a significant number of thunderstorms every year, with over 14.6 million taking place across the world annually.
- Approximately 70% of lightning bolts strike land rather than oceans.
- A storm named John was the longest-lasting Pacific tropical storm, continuing for 31 days. As it crossed the dateline twice, it changed status from a hurricane to a typhoon and back to a hurricane.
For more detailed information about Bozcaada's weather, including sunshine hours, humidity levels, and temperature data, visit our Bozcaada Climate page.
Bozcaada Weather by Month
Pick a month to see the average temperature, rainfall and sunshine in Bozcaada - and find the best time to visit.
Bozcaada 3-Day Forecast
Temperature Rainfall Sunshine
See the full Bozcaada climate overview or explore weather in Turkey.
Popular this month
Where to go in August - average daytime high across popular destinations.
Bucket list
Need travel inspiration? Check out our bucket list articles and be inspired.
 An idyllic and beautiful place to stay and eat near Saklikent National Park in Turkey
Serene Saklikent National Park near Fethiye, Turkey, with breathtaking gorges, tranquil restaurant, and unique experiences in nature. Perfect for a peaceful escape.
Sailing the Turquoise Coast: Discovering Turkey's Blue Voyage
Discover the beauty of Turkey's Turquoise Coast on a sailboat adventure, exploring ancient ruins, sun-soaked beaches, and lively harbor towns.
Balloon in Cappadocia Turkey
The best view of the special landscape of Cappadocia is from the air. It is a great idea to take a balloon trip at sunrise. An experience that belongs on your bucket list.
Istanbul, where East meets West
Istanbul, one of the most amazing cities in the world. It's a buzzing city and a mix of European and Asian, like a summer day in Madrid with a touch of Bangkok.