ClimateForecastAprilMay >>

Average temperature in San José del Cabo

The mean minimum and maximum temperatures over the year in San José del Cabo (Baja California Sur), Mexico.

Average monthly minimum and maximum temperature in San José del Cabo,

Feel free to add this climate graph to your website. Click the copy button above.

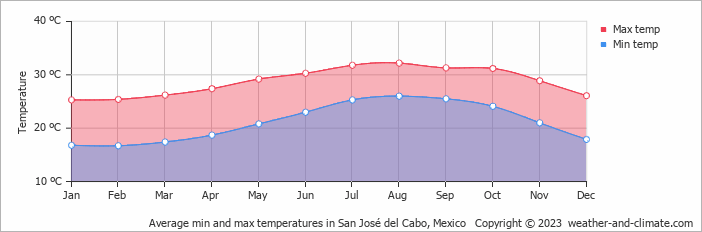
  • On average, the temperatures are always high.
  • On average, the warmest month is August with 32°C.
  • On average, the coolest month is January with 25°C.
  • The average annual maximum temperature is 29°C.
  • The average annual minimum temperature is 21°C.

Weather Forecasts for San José del Cabo

Sat   Apr 20
31°C | 19°C
S 25 km/h
clear and no rain

clear and no rain

Sun   Apr 21
32°C | 19°C
S 25 km/h
clear and no rain

clear and no rain

Mon   Apr 22
33°C | 20°C
S 29 km/h
clear and no rain

clear and no rain

Interested in more climate information?

Weather and Climate provides you with all the information you need about the climate in San José del Cabo.

Our site offers climate and forecast data for every country in the world. Are you going to Mexico? On this website you can find historical weather averages for many cities in Mexico. Not sure yet where to go? We now have a tool which recommends destinations that suit your ideal climate conditions. Find out where to go with our weather planner.

)