Maykop Temperature by Month
Maykop, Republic of Adygea, Russia has an average annual maximum temperature of 18°C (64°F), ranging from 5°C (41°F) in January to 30°C (86°F) in August. Below you'll find a full monthly breakdown and a comparison with cities worldwide.
Maykop Monthly Temperatures
The climate in Maykop is dynamic, ranging widely from chilly in winter to very warm in summer. Nights are significantly colder, with lows dropping from 17°C (63°F) in August to -4°C (25°F) in January.
The chart below illustrates the average maximum day and minimum night temperatures in Maykop by month:
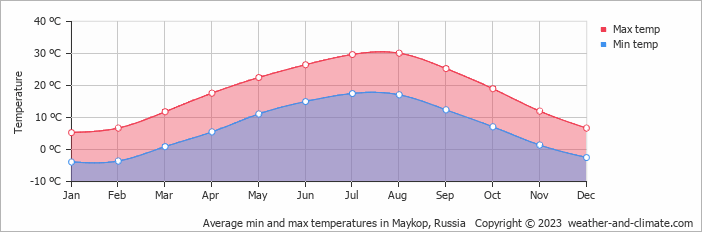
The coolest part of the day is typically between 4 AM and 6 AM, while 3 PM is usually the warmest, when solar heating is at its peak.
The chart below shows the average temperature throughout the year:
Historical Maykop Temperatures: 1976-2026
Browse day-by-day temperature records for Maykop spanning 51 years. Select any month and year to see actual high and low temperatures recorded on each day.
Temperature: Maykop vs Russia
The map below shows the annual temperature across Russia. You can also select individual months if you want to compare a specific time of year.
Maykop vs World: Temperature Compared
Maykop's average annual maximum temperature is 18°C (64°F). To put that in context, here's how it compares to a few well-known destinations:
Barcelona, Spain has an annual average of around 21°C (70°F), with warm summers and mild, fairly short winters.
Zermatt, Switzerland averages just 4°C (39°F) annually due to its altitude, with very cold winters and cool summers even at its warmest.
Seoul, South Korea averages 18°C (64°F) a year, with four clear seasons, cold winters, and hot humid summers.
Brisbane, Australia averages 26°C (79°F) a year, with warm winters and hot, humid summers.
Climate temperature data is typically calculated as a 30-year average. This smooths out year-to-year variability and gives a more reliable picture of what a place is actually like, rather than what happened in any single unusual year.
The readings come from a range of sources, land-based weather stations, ocean buoys, ships, and satellites. That data is collected by weather services around the world, then pooled, quality-checked, and averaged to produce the climate records you see here.
Whether a city sits on the coast or deep inland makes a significant difference to its climate. Coastal areas tend to have more stable temperatures year-round, large bodies of water absorb heat slowly in summer and release it gradually in winter, keeping extremes in check. Cities far from the sea don't benefit from that buffer, which is why continental climates tend to have hotter summers and colder winters than their coastal counterparts at the same latitude.
For more on Maykop's weather, including monthly rainfall, sunshine hours, and humidity, visit our Maykop climate page.
Maykop Weather by Month
Pick a month to see the average temperature, rainfall and sunshine in Maykop - and find the best time to visit.
Maykop 3-Day Forecast
Temperature Rainfall
See the full Maykop climate overview or explore weather in Russia.
Popular this month
Where to go in August - average daytime high across popular destinations.
Bucket list
Need travel inspiration? Check out our bucket list articles and be inspired.
 Visit the Kamchatka Peninsula
One of the most enchanting areas of Russia is the Kamchatka peninsula. It is how the earth must have looked like in prehistoric times.
Be amazed by the Altai mountains
The Atlai mountains are a sparsely populated area that most tourists have not yet discovered. Definitely bucket list material for the adventurous travelers among us.