Martignano Temperature by Month
The average annual maximum temperature in Martignano, Italy is 22°C (72°F), with daytime highs ranging from 14°C (57°F) in January to 32°C (90°F) in August. This page covers monthly averages, day-night differences, and how Martignano compares to cities worldwide.
Martignano Monthly Temperatures
Visitors to Martignano will encounter a climate influenced by big temperature differences across the year. Nighttime temperatures range from 23°C (73°F) in August to 8°C (46°F) in January.
The chart below illustrates the average maximum day and minimum night temperatures in Martignano by month:
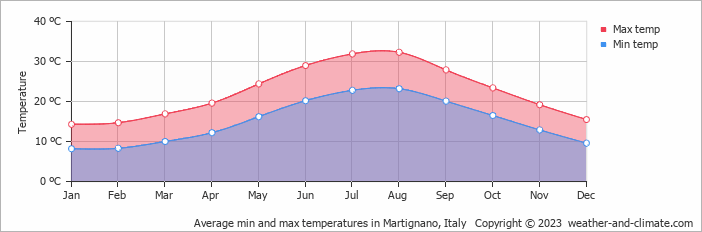
The coldest point of the day usually falls between 4 AM and 6 AM, with temperatures peaking around 3 PM. August, the city's warmest month, gets 305 hours of sunshine.
The chart below shows the average temperature throughout the year:
Temperature: Martignano vs Italy
The map below shows the annual temperature across Italy. You can also select individual months if you want to compare a specific time of year.
 very warm
 warm
warm
 pleasant
 moderate
 cold
cold
 very cold
Martignano vs World: Temperature Compared
Martignano's average annual maximum temperature is 22°C (72°F). To put that in context, here's how it compares to a few well-known destinations:
Seville, Spain averages 23°C (73°F) a year — one of the warmer cities in Western Europe, with long hot summers.
Reykjavík, Iceland averages 9°C (48°F) a year — mild summers by Icelandic standards, but cold winters and frequent wind.
Chicago, USA averages 15°C (59°F) annually — known for extreme seasonal swings, from bitterly cold winters to warm summers.
Brisbane, Australia averages 26°C (79°F) a year, with warm winters and hot, humid summers.
Climate temperature data is typically calculated as a 30-year average. This smooths out year-to-year variability and gives a more reliable picture of what a place is actually like, rather than what happened in any single unusual year.
The readings come from a range of sources — land-based weather stations, ocean buoys, ships, and satellites. That data is collected by weather services around the world, then pooled, quality-checked, and averaged to produce the climate records you see here.
Global average temperatures have risen by around 1.2°C since the pre-industrial era, and the effects are visible across many regions. Winters are milder on average, with fewer frost days and less snow in many parts of the world. Heatwaves are more frequent and more intense, and Europe's summers of 2018, 2019, and 2020 all set records.
Summers are also getting drier in some areas, while winter rainfall has increased in others. This contributies to higher river levels and more flooding. In many countries, spring arrives earlier and autumn lasts longer. It has knock-on effects for wildlife, agriculture, and local ecosystems.
For more on Martignano's weather — including monthly rainfall, sunshine hours, and humidity — visit our Martignano climate page.


