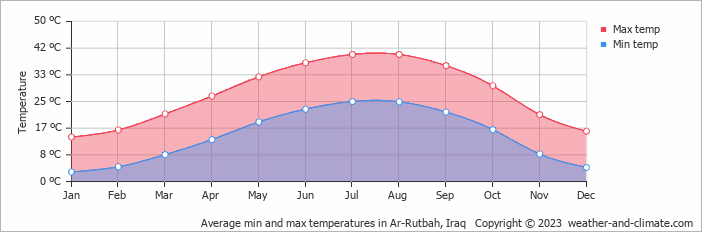
Ar-Rutbah Temperature by Month
This graph shows the average minimum and maximum temperatures throughout the year in Ar-Rutbah (), Iraq. The minimum temperature is often recorded between 4 AM and 6 AM, while the highest temperature is usually reached at 3 PM. During this time the sun's heating effect is the strongest.
Temperature patterns do vary with the seasons. In winter, the time of minimum and maximum temperatures can shift slightly compared to summer.
- The months of March, April, October and November have nice average temperatures.
- Hot season / summer is in May, June, July, August, September and October.
- On average, the warmest month is August with 40°C.
- On average, the coolest month is January with 14°C.
- The average annual maximum temperature is 28°C.
- The average annual minimum temperature is 14°C.
Current temperature in Ar-Rutbah
Fri Nov 15
24°C | 8°C
SW  11 km/h
11 km/halmost clear and no rain
Sat Nov 16
23°C | 12°C
E 7 km/h
7 km/hclear and no rain
Sun Nov 17
23°C | 8°C
SE 11 km/h
11 km/hpartly cloudy and no rain


