Nasiriya Weather & Climate: Best Time to Visit
The climate in Nasiriya, Iraq, is marked by large temperature swings across the seasons, ranging from 48°C (118°F) in August to 20°C (68°F) in January.
The city has an arid climate, receiving only 129 mm (5.1 in) of rainfall per year.
Monthly Temperature in Nasiriya
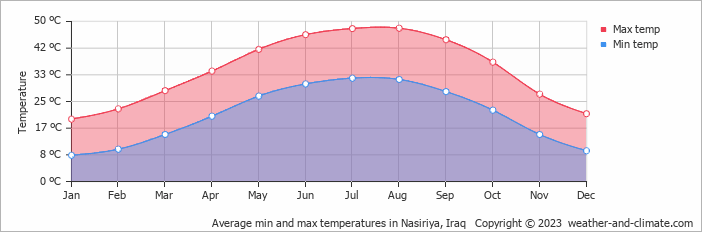
In Nasiriya, temperatures differ significantly between summer and winter months. On average, daytime temperatures range from a very hot 48°C (118°F) in August to a pleasant 20°C (68°F) in January.
Nighttime temperatures range from 32°C (90°F) in August to 8°C (46°F) in January.
Check out our detailed temperature page for more information.
Temperature ranges by month
Rainfall in Nasiriya
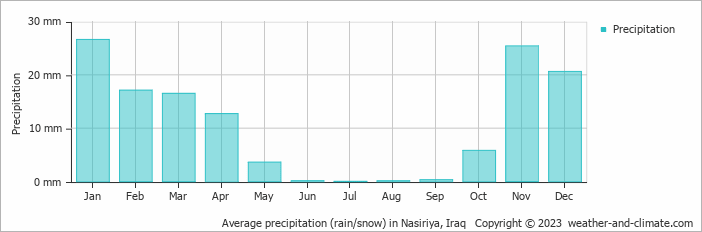
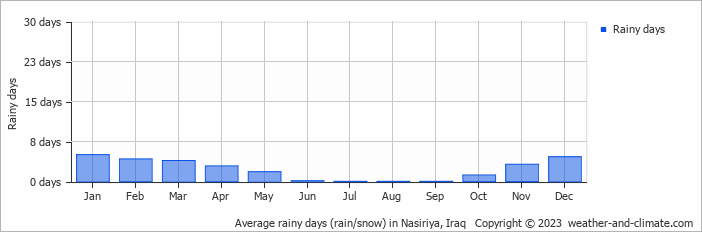
Nasiriya sits in an arid zone with minimal moisture, averaging 129 mm (5.1 in) of rainfall per year. The seasons in Nasiriya bring significant changes in precipitation. The wettest month, January, receives low rainfall, with an average of 27 mm (1.1 in) of precipitation. This rainfall is distributed across 5 rainy days.
In contrast, the driest month, July, experiences much less rainfall, totaling 0 mm (0 in) over 0 rainy days. These distinct seasonal differences provide diverse experiences throughout the year. For more details, please visit our Nasiriya Precipitation page.
The mean monthly precipitation over the year, including rain, hail, and snow
The average number of days each month with precipitation
Nasiriya 3-Day Forecast
Check the conditions for any month of the year.
Best Time to Visit Nasiriya
The best time to visit Nasiriya is during January, February, March, November and December, when the dry conditions provide ideal temperatures between 20°C (67°F) and 28°C (83°F). With minimal rainfall throughout the year, you can expect consistently clear, sunny days.While rain is rare, remember to stay hydrated and protect yourself from the sun while you're outside. Looking for inspiration on where to travel this year? We have a tool that recommends destinations based on your ideal conditions. Find out where to go with our weather planner.


