Ar-Rutbah Weather & Climate: Best Time to Visit
Average temperatures, rainfall, sunshine and the best time to visit Ar-Rutbah.
Climate overview of Ar-Rutbah
Ar-Rutbah, Iraq, experiences significant temperature variation throughout the year. Summers bring daytime highs of 40°C (104°F) in July, while winters cool to 14°C (57°F) in January.
The area sees almost no rainfall, totalling just 108 mm (4.3 in) per year.
Ar-Rutbah Weather by Month
Pick a month to see the average temperature, rainfall and sunshine in Ar-Rutbah — and find the best time to visit.
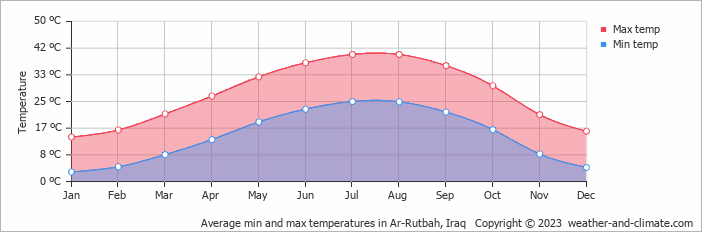
Monthly Temperature in Ar-Rutbah
Depending on the time of the year, temperatures range from very hot to moderate in Ar-Rutbah. Typically, average maximum daytime temperatures range from a very hot 40°C (104°F) in July to a moderate 14°C (57°F) in the coolest month, January.
Nights vary from 25°C (77°F) in July to around 3°C (37°F) during the colder months.
Check out our detailed temperature page for more information.
Temperature ranges by month
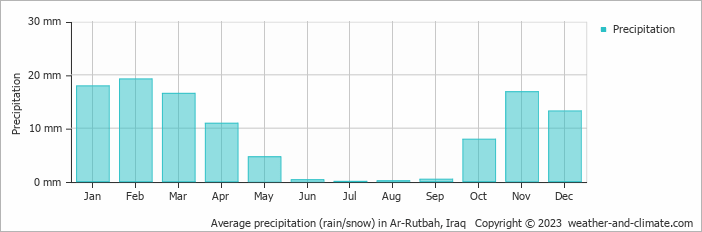
Rainfall in Ar-Rutbah
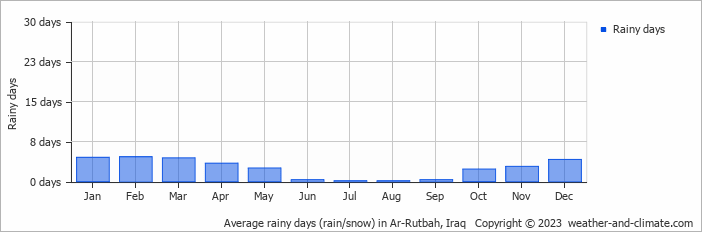
Ar-Rutbah has a dry climate with very low precipitation, averaging 108 mm (4.3 in) of rainfall annually. The climate in Ar-Rutbah shows significant variation throughout the year. Expect low rainfall in February, the wettest month, with an average of 19 mm (0.7 in) of precipitation over 5 rainy days.
In contrast, the driest month July offers drier and sunnier days, with around 0 mm (0 in) of rainfall over 0 rainy days. For more details, please visit our Ar-Rutbah Precipitation page.
The mean monthly precipitation over the year, including rain, hail, and snow
The average number of days each month with precipitation
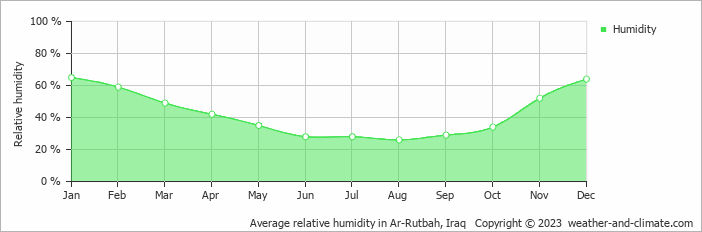
Humidity in Ar-Rutbah by Month
The relative humidity is moderate throughout the year in Ar-Rutbah.
The city experiences its highest humidity in January, reaching 65%. In August, the humidity drops to its lowest level at 26%. What does this mean? Read our detailed page on humidity levels for further details.
Relative humidity over the year
Best Time to Visit Ar-Rutbah
The consistently dry weather means you can step outside without worrying about rain, though remember to carry water and sun protection. Planning your next adventure but unsure where to go? Our climate tool suggests perfect locations tailored to your preferred weather conditions. Discover your ideal travel destination with our weather planner.
Frequently asked questions about the climate in Ar-Rutbah
What is the best time to visit Ar-Rutbah?
March, April and November typically offer the most optimal weather in Ar-Rutbah. In contrast, June, July, August and September tend to have less optimal conditions. Ar-Rutbah has a distinct dry season from January to December.
What temperatures can I expect in Ar-Rutbah?
Daytime highs range from 14°C (57°F) in January to 40°C (104°F) in July. Nighttime lows range from 3°C (37°F) to 25°C (77°F). Temperatures vary considerably through the year.
How much rain does Ar-Rutbah get?
Annual rainfall is around 108 mm (4.3 in). February is the wettest month with 19 mm (0.7 in), while July is the driest with 0 mm (0 in).
Ar-Rutbah 3-Day Forecast
Ar-Rutbah 3-Day Forecast
Ar-Rutbah on the map
Ar-Rutbah is highlighted — select any city to see its climate.
Popular this month
Where to go in June — average daytime high across popular destinations.