

















 7 of the most budget-friendly destinations in Europe
Discover Europe's top budget-friendly destinations including Budapest, Kotor, Krakow, and more, perfect for affordable and exciting travel.
Sunshine plays a big role in understanding the climate of a city. This page shows the total number of hours of direct sunlight per month and the average hours per day in Tyulenovo, Dobrich, Bulgaria. Long-term data from 1990 to 2020 was used to calculate these averages.
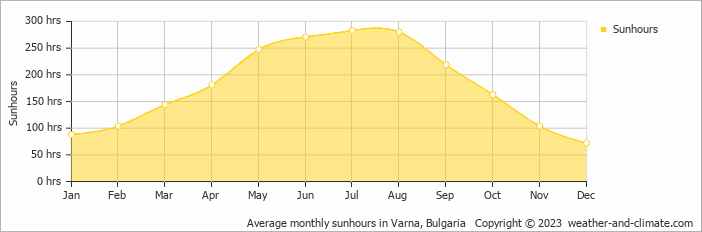
Sunshine in Tyulenovo varies greatly throughout the year. The sunniest month, July, reaches an impressive 283 hours, while December, the darkest month, offers only 72 hours. The total annual amount of sun is 2156 hours.
In Tyulenovo, summer days are longer and more sunny, with daily sunshine hours peaking at 9.4 hours in July. As the darker season arrives, the brightness of the sun becomes less. December sees a soft sun for only 2.4 hours per day.
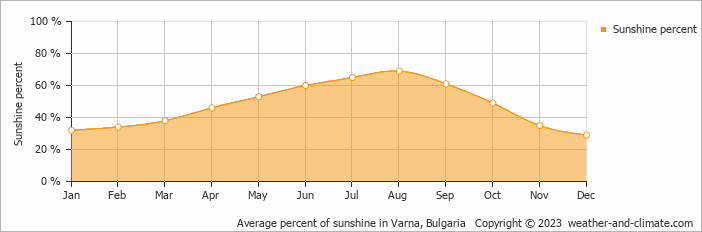
On average the sun shines 69% of the time during the day in August, the highest percentage of any month. December has the lowest percentage at 29%.
Tyulenovo enjoys an average of 2156 hours of sunshine annually. Let’s compare this with some popular tourist destinations:
Seville, Spain, enjoys an impressive 2920 hours of sunshine per year, making it an ideal destination even in winter.
In contrast, London, UK, receives only about 1659 hours of sunshine per year, known for its frequently overcast and rainy skies.
Beijing, China, has 2505 hours of sunshine annually, with clear, sunny days in winter.
Melbourne, Australia, has 2380 hours of sunshine annually, with its famous “four seasons in a day” weather pattern.
October, Tyulenovo’s wettest month, receives 31 mm (1.2 in) of rainfall and has a maximum daytime temperature of 18°C (64°F). During the driest month August you can expect a temperature of 27°C (81°F).
For more detailed insights into the city’s temperatures, check out our Temperature page. To explore more about precipitation patterns, visit our Tyulenovo Precipitation page.
Pick a month to see the average temperature, rainfall and sunshine in Tyulenovo - and find the best time to visit.
Temperature Rainfall Sunshine Humidity
See the full Tyulenovo climate overview or explore weather in Bulgaria.
Where to go in September - average daytime high across popular destinations.
 Sveti Vlas
 24°C (75°F) Nesebar24°C (75°F) Sunny Beach24°C (75°F) Varna City24°C (75°F) Sozopol24°C (75°F) Golden Sands23°C (73°F) Sofia23°C (73°F) Bansko20°C (68°F)
 Need travel inspiration? Check out our bucket list articles and be inspired.
7 of the most budget-friendly destinations in Europe
Discover Europe's top budget-friendly destinations including Budapest, Kotor, Krakow, and more, perfect for affordable and exciting travel.
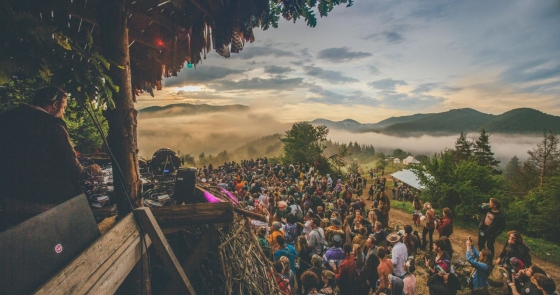 Meadows in the mountains
Meadows in the mountains is a world away from large line-ups and huge crowds. High in the Rhodope Mountains in Bulgaria.
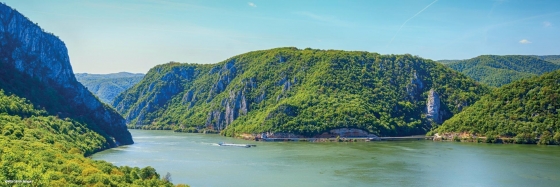
 Cycle the Danube trail
The Danube cycle route is one of the most popular cycling routes in Europe, and rightly so, because it is a varied route that is interesting both in terms of culture and nature.

 The 10 most charming villages in France
Discover France's top 10 beautiful villages. From Normandy to the Côte d'Azur, experience quaint squares and cobbled streets. Which one will you visit this summer?