Torgnon Sunshine Hours by Month
Sunshine is key to understanding how a place experiences its seasons. This page shows the total number of hours of direct sunlight per month and the average hours per day in Torgnon, Valle d'Aosta, Italy. Long-term data from 1990 to 2020 was used to calculate these averages.
Monthly hours of sunshine
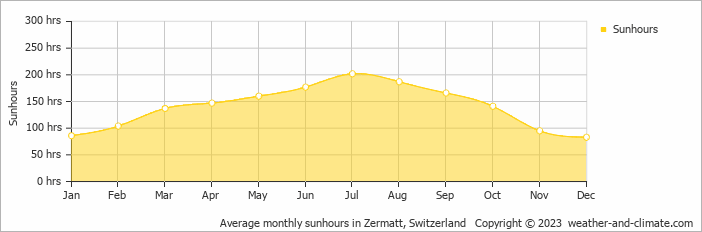
Sunshine in Torgnon varies greatly throughout the year. The sunniest month, July, reaches an impressive 202 hours, while December, the darkest month, offers only 83 hours. The total annual amount of sun is 1685 hours.
Daily hours of sunshine
In Torgnon, summer days are longer and more sunny, with daily sunshine hours peaking at 6.7 hours in July. As the darker season arrives, the brightness of the sun becomes less. December sees a soft sun for only 2.8 hours per day.
Average percent of sunshine
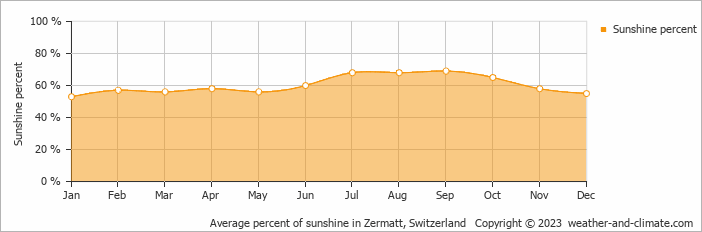
On average the sun shines 69% of the time during the day in September, the highest percentage of any month. January has the lowest percentage at 53%.
Torgnon vs Major Cities: Sunshine Compared
Torgnon enjoys an average of 1685 hours of sunshine annually. Let’s compare this with some popular tourist destinations:
In Barcelona, Spain, there are 2530 hours of sunshine annually and is a city that can be visited year-round.
In contrast, Juneau, Alaska, receives only about 1523 hours of sunshine per year and is known for its very short days in winter and frequently overcast conditions.
Vancouver, Canada, receives approximately 1940 hours of sunshine annually.
In Brisbane, Australia, the annual sunshine averages 2999 hours, making it one of Australia’s sunniest cities.
Related Climate Data for Torgnon
November, Torgnon’s wettest month, receives 114 mm (4.5 in) of snowfall and has a maximum daytime temperature of 1°C (34°F). During the driest month February you can expect a temperature of -3°C (27°F).
For more detailed insights into the city’s temperatures, check out our Temperature page. To explore more about precipitation patterns, visit our Torgnon Precipitation page.


