

















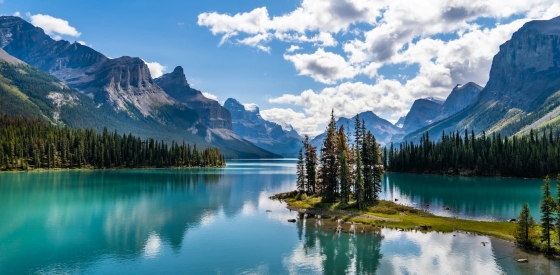
 The 5 most beautiful lakes in Canada
Explore Canada's stunning lakes: Lake Louise, Lake Superior, Maligne Lake, Emerald Lake, and Lake Okanagan, each offering unique beauty and activities.
When exploring climate, sunlight hours tell an important story. This page shows the total number of hours of direct sunlight per month and the average hours per day in Saint-Paul-de-Montminy, Quebec, Canada. These averages rely on historical data collected over 30 years, from 1990 to 2020.

Sunshine in Saint-Paul-de-Montminy varies greatly throughout the year. The sunniest month, July, reaches an impressive 253 hours, while November, the darkest month, offers only 77 hours. The total annual amount of sun is 1916 hours.
Seasonal changes in sunshine hours are quite obvious in Saint-Paul-de-Montminy. While July receives considerable daily sunshine with up to 8.4 hours, November marks the darkest time of the year, where sunshine is scarce with only 2.6 hours of sunlight per day.
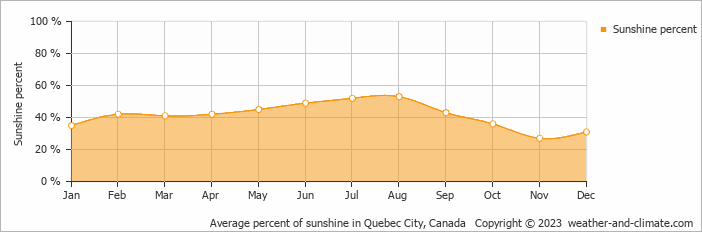
On average the sun shines 53% of the time during the day in August, the highest percentage of any month. November has the lowest percentage at 27%.
Saint-Paul-de-Montminy enjoys an average of 1916 hours of sunshine annually. Let’s compare this with some popular tourist destinations:
In Lisbon, Portugal, there are approximately 2801 hours of sunshine annually, highlighting its warm and sunny Mediterranean climate.
In contrast, Tromsø , Norway, receives only about 1270 hours of sunshine per year, known for the polar night with no sunlight for weeks during winter.
In Seoul, South Korea, there are approximately 2133 hours of sunshine per year, mostly during spring and autumn.
Melbourne, Australia, has 2380 hours of sunshine annually, with its famous “four seasons in a day” weather pattern.
June, Saint-Paul-de-Montminy’s wettest month, receives 137 mm (5.4 in) of rainfall and has a maximum daytime temperature of 22°C (72°F). During the driest month February you can expect a temperature of -5°C (23°F).
For more detailed insights into the city’s temperatures, check out our Temperature page. To explore more about precipitation patterns, visit our Saint-Paul-de-Montminy Precipitation page.
Pick a month to see the average temperature, rainfall and sunshine in Saint-Paul-de-Montminy - and find the best time to visit.
Temperature Rainfall Sunshine Humidity
See the full Saint-Paul-de-Montminy climate overview or explore weather in Canada.
Where to go in September - average daytime high across popular destinations.
Toronto 22°C (72°F) Niagara Falls23°C (73°F) Montréal
 22°C (72°F) Ottawa22°C (72°F) Quebec City
 20°C (68°F) Vancouver19°C (66°F) Calgary19°C (66°F) Whistler15°C (59°F)
 Need travel inspiration? Check out our bucket list articles and be inspired.
The 5 most beautiful lakes in Canada
Explore Canada's stunning lakes: Lake Louise, Lake Superior, Maligne Lake, Emerald Lake, and Lake Okanagan, each offering unique beauty and activities.
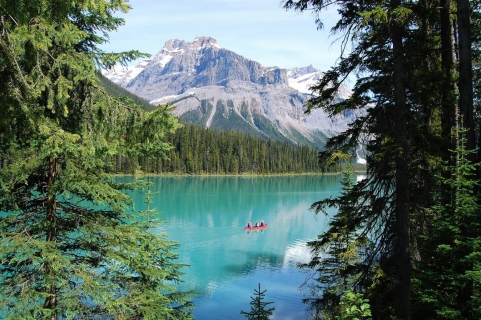 Canada in September: Where Is the Best Weather?
Compare September weather in Toronto, Montreal, Vancouver, Quebec City and Osoyoos to find Canada's warmest, driest and sunniest destinations.
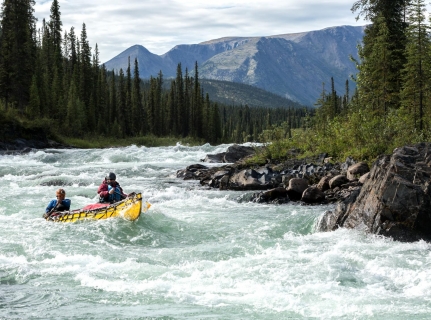 Canoeing the south Nahannii
The South Nahanni in the northwest of Canada is one of the most impressive wilderness rivers in the world. Canoeing the south Nahanni is something you must add to your bucket list.
 See Polar Bears in Churchill Canada
Thousands of bears gather at the small town of Churchill. In the evening the northern lights give a light show against the dark evening sky. An unforgettable experience.