Nabari Sunshine Hours by Month
To truly understand a climate, we must look at its sunshine. This page shows the total number of hours of direct sunlight per month and the average hours per day in Nabari, Mie, Japan. The numbers reflect climate data gathered over a 30-year period, from 1990 to 2020.
Monthly hours of sunshine
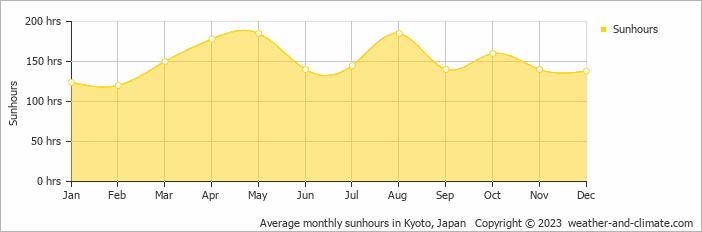
Nabari Nusa Penida experiences both sunny and cloudy or rainy periods, with some seasonal variation. It receives approximately 185 hours of sunshine in August and 120 hours in February, contributing to a total annual sunshine amount of 1805 hours.
Daily hours of sunshine
Enjoy up to 6.2 hours of daily sun in May, and experience slightly darker atmosphere in February, with about 4.0 hours of daily sunlight.
Nabari vs Major Cities: Sunshine Compared
Nabari enjoys an average of 1805 hours of sunshine annually. Let’s compare this with some popular tourist destinations:
The city of Rome, Italy, experiences 2470 hours of sunshine annually, adding to its charm as a year-round tourist destination.
In contrast, London, UK, receives only about 1659 hours of sunshine per year, known for its frequently overcast and rainy skies.
In Shanghai, China, the annual average sunshine is 1780 hours, with cloudier weather in summer.
Adelaide, Australia, enjoys 2770 hours of sunshine annually, with long, sunny summers.
Related Climate Data for Nabari
June, Nabari’s wettest month, receives 174 mm (6.9 in) of rainfall and has a maximum daytime temperature of 27°C (81°F). During the driest month December you can expect a temperature of 11°C (52°F).
For more detailed insights into the city’s temperatures, check out our Temperature page. To explore more about precipitation patterns, visit our Nabari Precipitation page.