Barra Vieja Sunshine Hours by Month
Sunshine is key to understanding how a place experiences its seasons. This page shows the total number of hours of direct sunlight per month and the average hours per day in Barra Vieja, Guerrero, Mexico. The numbers reflect climate data gathered over a 30-year period, from 1990 to 2020.
Monthly hours of sunshine
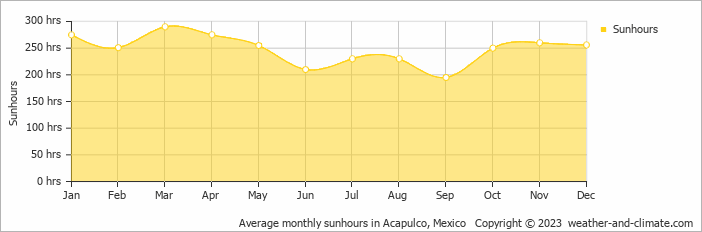
While the amount of sunshine in Barra Vieja changes moderately throughout the year, the annual total remains impressive at around 2977 hours. Expect slightly brighter days in March and a subtle dip in September.
Daily hours of sunshine
Enjoy up to 9.7 hours of daily sun in March, and experience slightly darker atmosphere in September, with about 6.5 hours of daily sunlight.
Barra Vieja vs Major Cities: Sunshine Compared
Barra Vieja enjoys an average of 2977 hours of sunshine annually. Let’s compare this with some popular tourist destinations:
The city of Rome, Italy, experiences 2470 hours of sunshine annually, adding to its charm as a year-round tourist destination.
Manchester, UK, experiences just around 1420 hours of sunshine annually.
Stockholm, Sweden, receives approximately 1907 hours of sunshine annually.
Adelaide, Australia, enjoys 2770 hours of sunshine annually, with long, sunny summers.
Related Climate Data for Barra Vieja
September, Barra Vieja’s wettest month, receives 31 mm (1.2 in) of rainfall and has a maximum daytime temperature of 31°C (88°F). During the driest month April you can expect a temperature of 32°C (90°F).
For more detailed insights into the city’s temperatures, check out our Temperature page. To explore more about precipitation patterns, visit our Barra Vieja Precipitation page.