Bad Hindelang Sunshine Hours by Month
Sunshine plays a big role in understanding the climate of a city. This page shows the total number of hours of direct sunlight per month and the average hours per day in Bad Hindelang, Bavaria, Germany. These averages rely on historical data collected over 30 years, from 1990 to 2020.
Monthly hours of sunshine
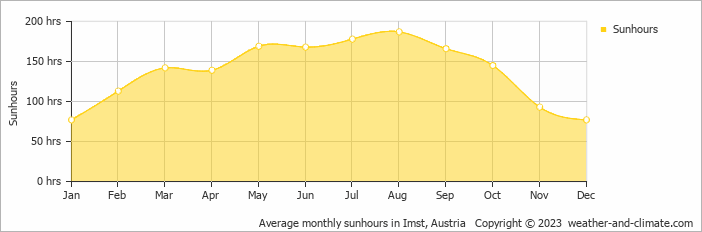
If you're visiting Bad Hindelang, timing is key. In August, you can enjoy up to 187 hours of sunshine, while the shorter days of January provide just 77 hours. The total annual amount of sun is 1654 hours.
Daily hours of sunshine
For those who appreciate different seasons, Bad Hindelang serves as an ideal destination. Expect longer, more sun-filled days in August with an average of 6.2 hours of sunshine daily, and embrace the darker days in January, offering only 2.6 hours of daily sunlight.
Average percent of sunshine
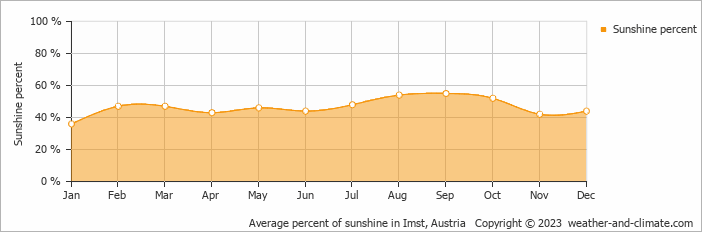
On average the sun shines 55% of the time during the day in September, the highest percentage of any month. January has the lowest percentage at 36%.
Bad Hindelang vs Major Cities: Sunshine Compared
Bad Hindelang enjoys an average of 1654 hours of sunshine annually. Let’s compare this with some popular tourist destinations:
Athens, Greece, enjoys 2769 hours of sunshine each year, making it one of the sunniest destinations in the Mediterranean region.
Manchester, UK, experiences just around 1420 hours of sunshine annually.
Toronto, Canada, sees around 2071 hours of sunshine each year, with especially long, bright summer days.
In Brisbane, Australia, the annual sunshine averages 2999 hours, making it one of Australia’s sunniest cities.
Related Climate Data for Bad Hindelang
June, Bad Hindelang’s wettest month, receives 219 mm (8.6 in) of rainfall and has a maximum daytime temperature of 18°C (64°F). During the driest month October you can expect a temperature of 12°C (54°F).
For more detailed insights into the city’s temperatures, check out our Temperature page. To explore more about precipitation patterns, visit our Bad Hindelang Precipitation page.
Bad Hindelang Weather by Month
Pick a month to see the average temperature, rainfall and sunshine in Bad Hindelang - and find the best time to visit.


Bad Hindelang 3-Day Forecast
Temperature Rainfall Sunshine Humidity
See the full Bad Hindelang climate overview or explore weather in Germany.
Popular this month
Where to go in August - average daytime high across popular destinations.
 Berlin
 26°C (79°F) Düsseldorf24°C (75°F) Hanover24°C (75°F) Munich25°C (77°F) Cologne25°C (77°F) Hamburg24°C (75°F) Winterberg
 22°C (72°F) Binz
 21°C (70°F)













Bucket list
Need travel inspiration? Check out our bucket list articles and be inspired.
The 10 most beautiful towns in Germany
Explore Germany's hidden gems with our guide to 10 stunning cities beyond Berlin. Discover historic towns, unique culture, and cozy atmospheres."
The dreamlike scenery of the German Alps
Nature in the most south-eastern part of Germany is impressive. The German Alps, with their diversity of landscapes, are an ideal destination for a wonderful holiday in nature.
Discover Germany's Black Forest
Immerse yourself in nature and enjoy sustainable tourism practices in Germany's Black Forest. Hike, do yoga, and savor local organic cuisine and beer.
 Cycle the Danube trail
The Danube cycle route is one of the most popular cycling routes in Europe, and rightly so, because it is a varied route that is interesting both in terms of culture and nature.