

















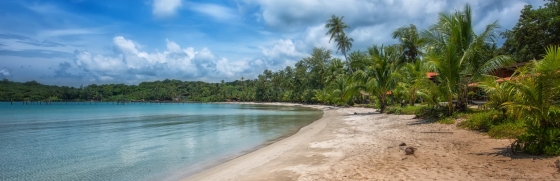
 Discover Kok Kood: a hidden gem in Thailand
Discover the hidden gem of Thailand - Koh Kood! Explore stunning beaches, waterfalls and eco-friendly resorts while enjoying a peaceful atmosphere away from the crowds.
The mean monthly wind speed over the year in Ban Phae Khwang (), Thailand.
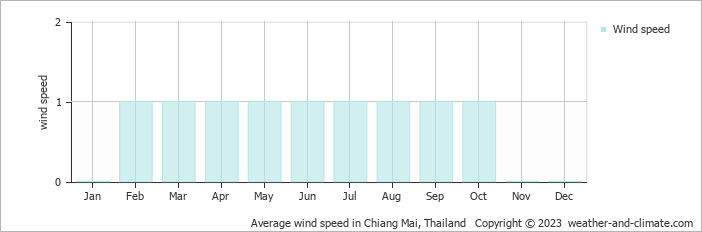
The average annual wind speed in Ban Phae Khwang spans from () to 1 m/s (2 knots).
February, March, April, May, June, July, August, September and October has average wind speeds of 1 m/s (2 knots). This means most days feel quite still with minimal air movement. Leaves barely move and dust stays settled. The speed translates to 3.6 kilometers per hour or 2.2 miles per hour. While some days have no wind at all, others may experience light drafts reaching 3 m/s (6 knots).
For more detailed information about Ban Phae Khwang’s weather, including monthly rainfall, sunshine hours, and humidity levels, visit our Ban Phae Khwang climate page.
Pick a month to see the average temperature, rainfall and sunshine in Ban Phae Khwang - and find the best time to visit.
Temperature Rainfall Sunshine Humidity Wind Speed
See the full Ban Phae Khwang climate overview or explore weather in Thailand.
Where to go in September - average daytime high across popular destinations.
Bangkok 34°C (93°F) Chiang Mai33°C (91°F) Jomtien Beach32°C (90°F) Hua Hin32°C (90°F) Ao Nang Beach30°C (86°F) Koh Samui30°C (86°F) Ko Lanta30°C (86°F) Patong Beach29°C (84°F)
 Need travel inspiration? Check out our bucket list articles and be inspired.
Discover Kok Kood: a hidden gem in Thailand
Discover the hidden gem of Thailand - Koh Kood! Explore stunning beaches, waterfalls and eco-friendly resorts while enjoying a peaceful atmosphere away from the crowds.
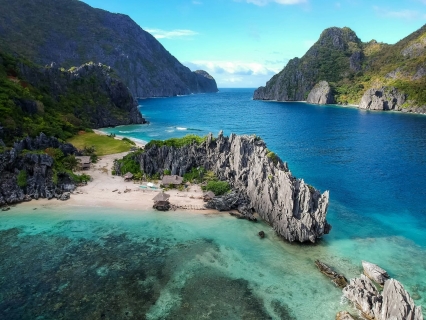
 Where to Travel in July and August: Mexico, Thailand, Indonesia or Somewhere Else?
Compare July and August weather in Mexico, Thailand, Indonesia, Zanzibar and Sri Lanka, using historical climate data for temperature, rainfall and sunshine.
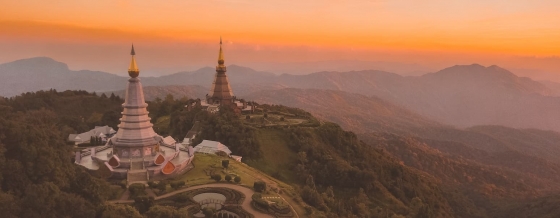 Discover Thailand: An Ultimate Guide for Yogis
Explore Thailand's best for yogis: serene retreats, spiritual growth, and adventure. Dive into yoga, meditation, and nature's tranquility for an unforgettable journey.
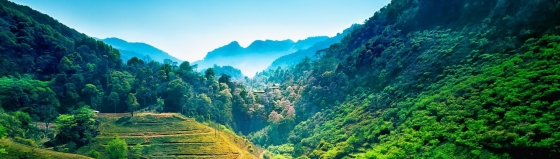 Trekking in Northern Thailand
One of the most beautiful attractions in Thailand is trekking along mountain villages north of Chiang Mai. The best time to trek is November until February.