

















 Discover Kok Kood: a hidden gem in Thailand
Discover the hidden gem of Thailand - Koh Kood! Explore stunning beaches, waterfalls and eco-friendly resorts while enjoying a peaceful atmosphere away from the crowds.
Average temperatures, rainfall, sunshine and the best time to visit Thung Wua Laen Beach.
 –
–
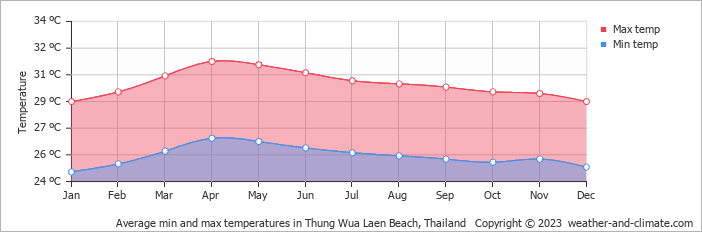
The climate in Thung Wua Laen Beach, Chumphon Province, Thailand, is remarkably consistent, with temperatures year-round averaging 30°C (86°F). The warmest month is April at 32°C (90°F), and the coolest is January at 29°C (84°F).
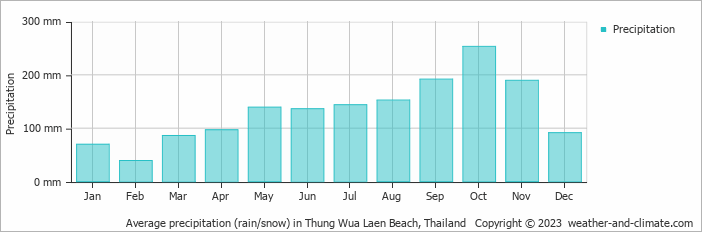
The city has a wet climate, receiving around 1588 mm (63 in) of rainfall per year. Despite the high annual total, it has a distinct rainy season from September to November. October is the wettest month.
Pick a month to see the average temperature, rainfall and sunshine in Thung Wua Laen Beach - and find the best time to visit.
In Thung Wua Laen Beach temperatures are generally consistent throughout the year. On average, daytime temperatures range from a very warm 32°C (90°F) in April to a comfortable 29°C (84°F) in January.
Nighttime temperatures range from 27°C (81°F) in April to 25°C (77°F) in January.
Check out our detailed temperature page for more information.
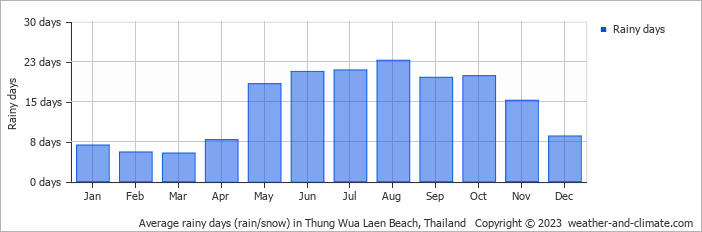
Thung Wua Laen Beach experiences significant rainfall throughout the year, averaging 1588 mm (63 in) of precipitation annually. The seasons in Thung Wua Laen Beach bring significant changes in precipitation. The wettest month, October, receives heavy rainfall, with an average of 253 mm (10 in) of precipitation. This rainfall is distributed across 20 rainy days.
In contrast, the driest month, February, experiences much less rainfall, totaling 39 mm (1.5 in) over 6 rainy days. These distinct seasonal differences provide diverse experiences throughout the year. For more details, please visit our Thung Wua Laen Beach Precipitation page.
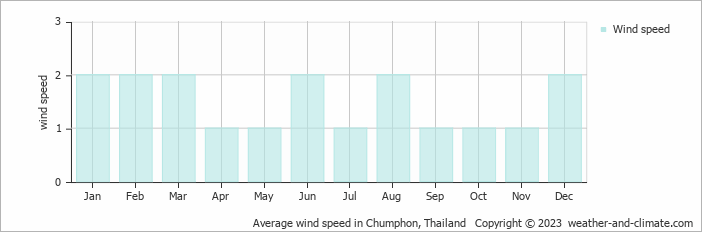
The average wind speed over the year ranges from 1 m/s (2 knots) to 2 m/s (4 knots). It is lower in April, May, July, September, October and November and higher in January, February, March, June, August and December. What does this mean?
Monthly ratings reflect general weather comfort, based on daytime temperature and rainfall. Swimming and winter conditions are highlighted separately where relevant.
January and December typically offer the most optimal weather in Thung Wua Laen Beach. In contrast, September, October and November tend to have less optimal conditions. Thung Wua Laen Beach has a distinct rainy season from September to November.
Daytime highs range from 29°C (84°F) in January to 32°C (90°F) in April. Nighttime lows range from 25°C (77°F) to 27°C (81°F). Temperatures stay relatively stable year-round.
Annual rainfall is around 1588 mm (63 in). October is the wettest month with 253 mm (10 in), while February is the driest with 39 mm (1.5 in).
Thung Wua Laen Beach is highlighted - select any city to see its climate.
Where to go in September - average daytime high across popular destinations.
Bangkok 34°C (93°F) Chiang Mai33°C (91°F) Jomtien Beach32°C (90°F) Hua Hin32°C (90°F) Ao Nang Beach30°C (86°F) Koh Samui30°C (86°F) Ko Lanta30°C (86°F) Patong Beach29°C (84°F)
 Need travel inspiration? Check out our bucket list articles and be inspired.
Discover Kok Kood: a hidden gem in Thailand
Discover the hidden gem of Thailand - Koh Kood! Explore stunning beaches, waterfalls and eco-friendly resorts while enjoying a peaceful atmosphere away from the crowds.

 Where to Travel in July and August: Mexico, Thailand, Indonesia or Somewhere Else?
Compare July and August weather in Mexico, Thailand, Indonesia, Zanzibar and Sri Lanka, using historical climate data for temperature, rainfall and sunshine.
 Discover Thailand: An Ultimate Guide for Yogis
Explore Thailand's best for yogis: serene retreats, spiritual growth, and adventure. Dive into yoga, meditation, and nature's tranquility for an unforgettable journey.
 Trekking in Northern Thailand
One of the most beautiful attractions in Thailand is trekking along mountain villages north of Chiang Mai. The best time to trek is November until February.