Sayulita Weather & Climate: Best Time to Visit
Average temperatures, rainfall, sunshine and the best time to visit Sayulita.
Climate overview of Sayulita
The climate in Sayulita, Riviera Nayarit, Mexico, is remarkably consistent, with temperatures year-round averaging 28°C (82°F). The warmest month is August at 31°C (88°F), and the coolest is February at 26°C (79°F).
Sayulita sees a moderate amount of rainfall, totalling around 966 mm (38 in) per year. It experiences a distinct dry season from November to May, creating some seasonal variation.
Sayulita Weather by Month
Pick a month to see the average temperature, rainfall and sunshine in Sayulita — and find the best time to visit.
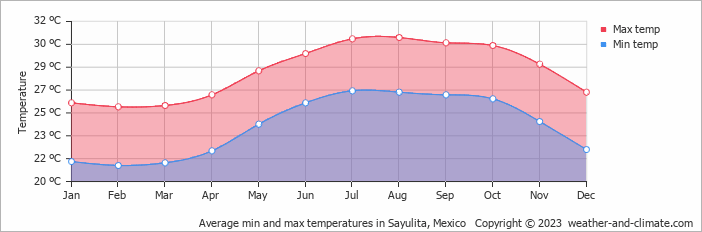
Monthly Temperature in Sayulita
In Sayulita temperatures are generally consistent throughout the year. Average maximum daytime temperatures range from a very warm 31°C (88°F) in August, the warmest time of the year, to a comfortable 26°C (79°F) during cooler months like February.
At night, you can expect temperatures ranging from 27°C (81°F) in August to around 21°C (70°F) during February.
Check out our detailed temperature page for more information.
Temperature ranges by month
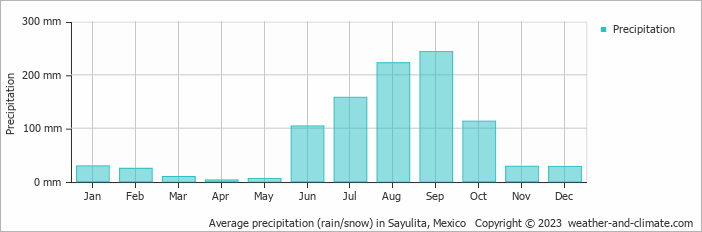
Rainfall in Sayulita
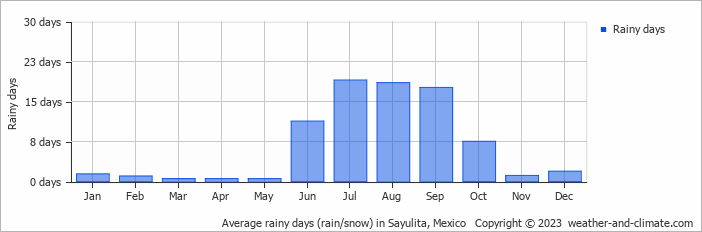
On average, Sayulita receives a reasonable amount of rainfall, with an annual precipitation of 966 mm (38 in). Significant seasonal changes in precipitation occur throughout the year. In the wettest month, September it receives heavy rainfall, averaging 243 mm (9.6 in) of precipitation, recorded across 18 rainy days. In contrast, the driest month April brings less rainfall, with 2.6 mm (0.1 in) over a single rainy day. For more details, please visit our Sayulita Precipitation page.
The mean monthly precipitation over the year, including rain, hail, and snow
The average number of days each month with precipitation
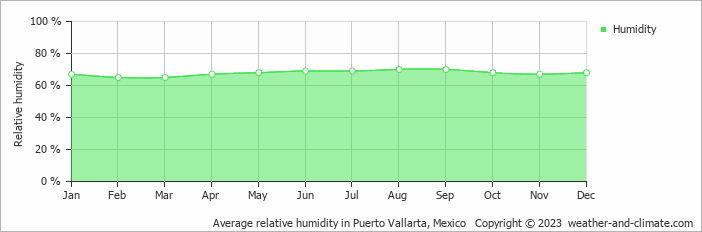
Humidity in Sayulita by Month
The relative humidity is high throughout the year in Sayulita.
The city experiences its highest humidity in August, reaching 70%. In February, the humidity drops to its lowest level at 65%. What does this mean? Read our detailed page on humidity levels for further details.
Relative humidity over the year
Best Time to Visit Sayulita
Be prepared for heavier rainfall during August and September, the wettest period of the year. Seeking the perfect travel destination for this year? We've created a tool that suggests locations matching your desired weather. Let our weather planner guide your travel decisions.
Frequently asked questions about the climate in Sayulita
What is the best time to visit Sayulita?
January, February, March, April, May, November and December typically offer the most optimal weather in Sayulita. In contrast, August and September tend to have less optimal conditions. Sayulita has a distinct dry season from November to May.
What temperatures can I expect in Sayulita?
Daytime highs range from 26°C (79°F) in February to 31°C (88°F) in August. Nighttime lows range from 21°C (70°F) to 27°C (81°F). Temperatures stay relatively stable year-round.
How much rain does Sayulita get?
Annual rainfall is around 966 mm (38 in). September is the wettest month with 243 mm (9.6 in), while April is the driest with 2.6 mm (0.1 in).
Sayulita 3-Day Forecast
Sayulita 3-Day Forecast
Sayulita on the map
Sayulita is highlighted — select any city to see its climate.
Popular this month
Where to go in July — average daytime high across popular destinations.
Bucket list
Need travel inspiration? Check out our bucket list articles and be inspired.
 Explore the Majestic Copper Canyons of Mexico
Explore the vast Copper Canyons in Chihuahua, Mexico—larger than the Grand Canyon. Discover scenic train rides, hikes, and the Tarahumara people.
These are the most beautiful Mayan ruins and Mayan temples in Mexico
Mexico is a destination where you can immerse yourself in ancient cultures and civilizations. In this article we have listed our favorite Mayan ruins.
Tips, to-do's and nicest restaurants in Mexico City
Mexico City, one of the most famous and notorious cities of the world. The best time to visit is between March and May, but it can be visited year round.
Zihuatanejo: A Pacific paradise with beautiful beaches
Zihuatanejo has some of Mexico's top beaches. Unlike other off-the-beaten-path destinations in Mexico, Zihua is very accessible and sustainable.