San Gregorio di Catania Weather and Climate: A Comprehensive Guide
San Gregorio di Catania experiences great temperature shifts.
The city's weather can transition from very warm days
to mild weather.
It maintains moderate precipitation patterns.
Now, let’s explore all the climate details to give you a full picture.
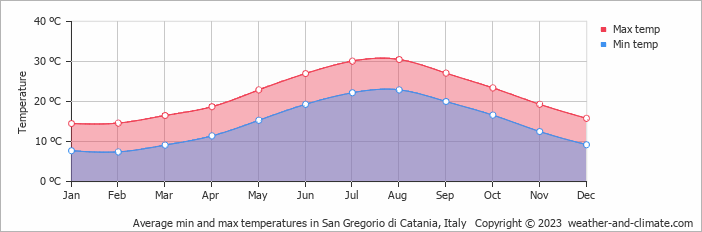
Average maximum day and minimum night temperature
The climate in San Gregorio di Catania is known for significant temperature differences throughout the year, making the weather dynamic. Typically, average maximum daytime temperatures range from a very warm 31°C in August to a moderate 15°C in the coolest month, February.
Nights are cooler, with lows often dropping to around 7°C during the colder months. Check out our detailed temperature page for more information.Temperature ranges by month
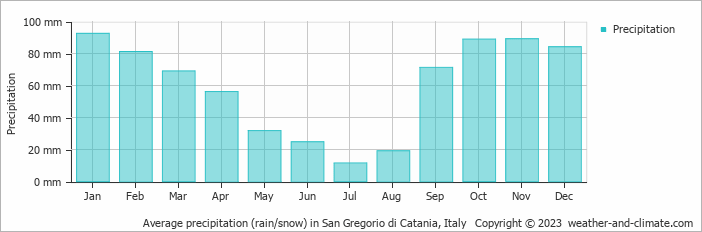
Precipitation and rainy days
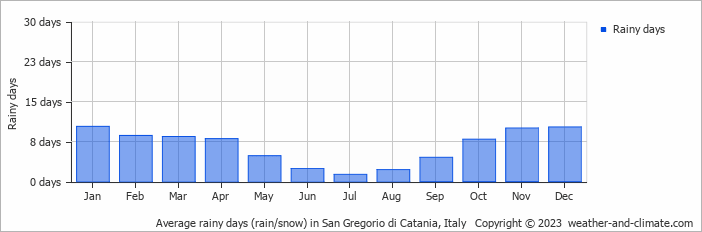
Generally, San Gregorio di Catania receives mid-range precipitation levels, with 719 mm annually. The climate in San Gregorio di Catania shows significant variation throughout the year. Expect moderate rainfall in January, with an average of 93 mm of precipitation over 10 rainy days. In contrast, July offers drier and sunnier days, with around 12 mm of rainfall over a single rainy day. For more details, please visit our San Gregorio di Catania Precipitation page.The mean monthly precipitation over the year, including rain, hail and snow
The average number of days each month with precipitation
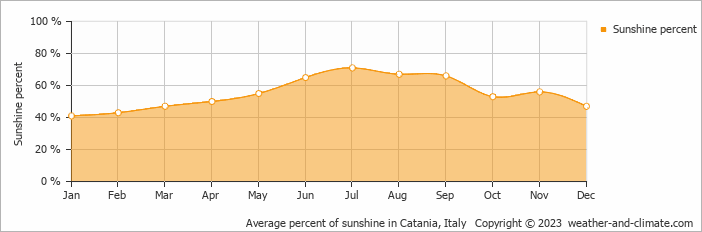
Sunshine over the year
For those who appreciate different seasons, San Gregorio di Catania serves as an ideal destination. Expect longer, more sun-filled days in July with an average of 10.5 hours of sunshine daily, and embrace the darker days in January, offering only 3.7 hours of daily sunlight. Visit our detailed sunshine hours page for more information.Monthly hours of sunshine
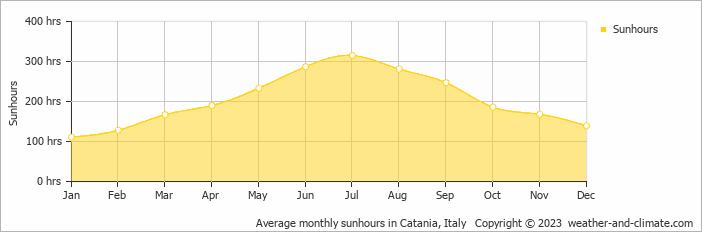
Daily hours of sunshine
Daily percentage of sunshine
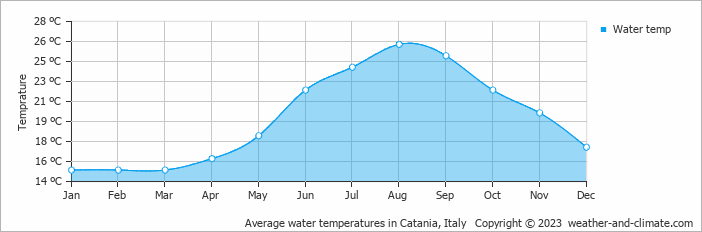
Average water temperature
The mean water temperature over the year ranges from 15°C in January to 26°C in August.
Water temperature over the year
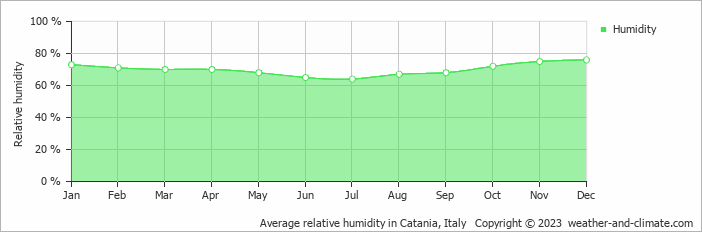
Average humidity
The relative humidity is high throughout the year in San Gregorio di Catania.
The city experiences its highest humidity in December, reaching 76%. In July, the humidity drops to its lowest level at 64%. Explore our detailed page on humidity levels for further details.
Relative humidity over the year
partly cloudy and small chance of slight rain broken clouds and rain partly cloudy and chance of slight rainForecast for San Gregorio di Catania
 2 m/s
2 m/s![]() 7 m/s
7 m/s![]() 1 m/s
1 m/s![]()
The best time of year to visit San Gregorio di Catania in Italy
During the months of May and October you are most likely to experience good weather with pleasant average temperatures that fall between 20°C and 26°C.Other facts from our historical weather data:
The hottest season / summer takes place in June, July, August and September.
Yes, the months of July and August are very dry.
August has an average maximum temperature of 31°C and is the warmest month of the year.
The coldest month is February with an average maximum temperature of 15°C.
January tops the wettest month list with 93 mm of rainfall.
July is the driest month with 12 mm of precipitation.
July is the sunniest month with an average of 315 hours of sunshine.
No idea where to travel to this year? We have a tool that recommends destinations based on your ideal conditions. Find out where to go with our weather planner.


